At times in history, there have been concerns that demand for wood (timber) would be greater than the ability to supply it, but that concern has recently dissipated. The wood supply and demand situation has changed because of market transitions, economic downturns, and continued forest growth. This article provides a concise overview of this change as it relates to the United States, looking at nationwide trends in the pulp and paper sector and the solid wood and composite wood product sectors (lumber and wood panels) and also nationwide trends in timber growth, timber removals, and real prices for timber.
Pulp and paper trends
Until the 1990s, wood pulp production in the United States trended more or less continuously upward. Figure 1 shows annual U.S. wood pulp production from the beginning of the twentieth century through 2009. The upward trend through most of the twentieth century may have suggested until recently that pulpwood demand might lead to unsustainable pressure on timber supply. For many decades, the United States was by far the world's leading producer of wood pulp, and it still is, but the trend in U.S. wood pulp production transitioned after peaking in the mid-1990s and has generally declined over the past 15 years.
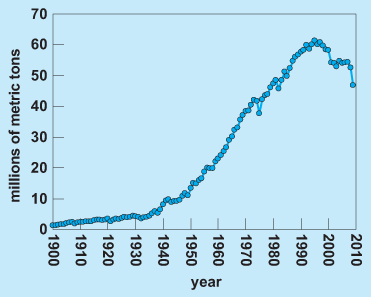
Wood pulp is used mainly for paper and paperboard production, so the transition in wood pulp output reflects a transition in paper and paperboard markets. Economic recessions negatively impacted paper and paperboard demand in 2001–2002 and more recently in 2008–2009, which resulted in U.S. paper and paperboard consumption declining by 25% from 1999 to 2009. Furthermore, since the 1990s, U.S. paper and paperboard consumption deviated from the trend in overall U.S. economic growth, represented by real gross domestic product (GDP), as shown in Fig. 2.
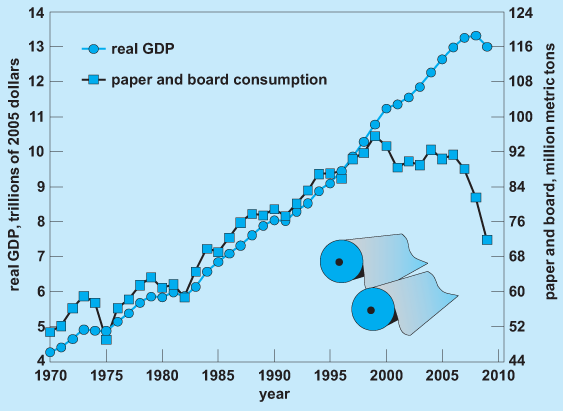
Historically, U.S. paper and paperboard demand was closely correlated with real U.S. GDP growth, and thus the transition in paper and paperboard demand reflects structural changes. Important structural changes included reduced demand for printing paper because of declining advertising expenditures for print media (newspapers, magazines, and other print media), especially as advertising expenditures have shifted toward electronic media, and displacement of growth in U.S. packaging paper and board demand as domestic manufacturing of consumer goods was displaced by growth in goods imported from other countries. Not surprisingly, China recently became the leading global producer of paper and paperboard products (edging out the United States in total tonnage, although not necessarily in product value).
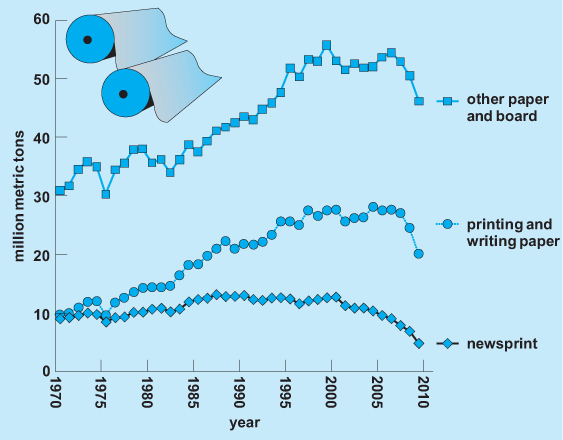
Figure 3 illustrates trends in U.S. paper and paperboard consumption for several principal product categories—newsprint, printing and writing paper, and other paper and paperboard (including all packaging paper and board products, tissue and sanitary products, and other industrial paper and board products). The trends indicate that the decline in demand has been more significant for printing paper products from 1999 to 2009 (with newsprint consumption down by 61%, and printing and writing paper down by 26%), whereas other paper and board consumption has declined by 17%.
As stated previously, the United States is the world's leading producer of wood pulp. Nevertheless, the unabated growth in U.S. pulp and paper output throughout most of the twentieth century has transitioned to declining output levels and declining pulpwood demands since the late 1990s. In addition to paper and paperboard, pulpwood is also used in the manufacture of oriented strandboard (OSB) and miscellaneous other lesser products. These uses are small in comparison to the demands on pulpwood for wood pulp. Certainly, any view that pulpwood demands will exert unsustainable pressure on U.S. timber supply should give way to a less ominous perspective, given the declining trends in U.S. pulp and paper production and the much lesser demands for other pulpwood-based products.
Solid wood and composite wood product trends
Solid wood products (chiefly, lumber and plywood) and composite wood products (chiefly, other wood panels, such as particleboard and OSB) are important materials for the construction, manufacturing, and shipping segments of the U.S. economy. Nearly all new single-family houses and low-rise multifamily residential structures are framed with lumber and sheathed with wood panels. Large amounts of such products are used also in the construction of low-rise nonresidential buildings and in the upkeep and improvement of existing structures. Solid wood and composite wood products are used extensively in various manufactured products, and nearly all manufactured products are shipped on wooden pallets.
At the turn of the new millennium, total U.S. consumption of solid wood and composite wood products was growing steadily, but consumption declined in recent years. Lumber consumption increased from 120 million cubic meters (m3) in 2000 to nearly 136 million m3 in 2005 (Table 1). Consumption of all other wood products increased similarly. In 2005, a record high of 204 million m3 of solid wood and composite wood products were consumed in the United States. However, during 2005, the rumblings of an impending economic downturn were beginning to be felt. In 2006, consumption of wood products began a steady and dramatic decline. By 2009, total solid wood and composite wood products consumption was just 110 million m3, the lowest total level of consumption since the 1980s.
Structural |
Nonstructural |
Engineered |
|||
|---|---|---|---|---|---|
Lumber* |
panels† |
panels‡ |
wood§ |
Total | |
Year |
(million m3) |
(million m3) |
(million m3) |
(million m3) |
(million m3) |
2000 |
120.4 |
32.3 |
22.5 |
4.4 |
179.6 |
2001 |
117.8 |
31.6 |
21.1 |
4.8 |
175.4 |
2002 |
121.5 |
33.1 |
21.6 |
5.1 |
181.3 |
2003 |
121.4 |
33.8 |
21.7 |
5.6 |
182.5 |
2004 |
133.6 |
35.4 |
24.1 |
6.3 |
199.3 |
2005 |
135.9 |
37.5 |
23.8 |
6.5 |
203.6 |
2006 |
128.1 |
34.3 |
23.0 |
6.4 |
191.8 |
2007 |
113.8 |
32.8 |
20.6 |
5.1 |
172.3 |
2008¶ |
96.0 |
23.6 |
16.7 |
3.6 |
139.9 |
2009¶ |
75.1 |
19.1 |
13.6 |
2.4 |
110.2 |
*Includes softwood and hardwood lumber.
†Includes softwood plywood and oriented strandboard.
‡Includes hardwood plywood, particleboard, medium-density fiberboard, hardboard, and insulation board.
§Includes prefabricated wood I-joists, glued laminated timbers, laminated veneer lumber, and other structural composite lumber.
¶Preliminary data.
Sources: C. Adair, Market Outlook: Structural Panels and Engineered Wood Products 2009–2014, American Plywood Association, Tacoma, WA, 2009; J. L. Howard, U.S. Timber Production, Trade, Consumption, and Price Statistics 1965–2005, USDA Forest Service/Forest Products Laboratory, Madison, WI, 2010.
Much of the recent decline in wood products consumption can be linked directly to the residential housing market. Between 2000 and 2005, single-family housing starts increased from 1.2 to 1.7, before falling to less than 0.5 million in 2009. The result was a drop in total wood products consumption in residential construction from 116 million m3 in 2005 to 45 million m3 in 2009 (Table 2). This 60% decline in total wood products use for residential housing construction accounted for nearly 80% of the total drop in solid wood and composite wood products consumption from 2005 to 2009.
Construction |
|||||||
|---|---|---|---|---|---|---|---|
Residential* |
Nonresidential |
Total |
Manufacturing |
Packaging and shipping |
Other† |
Total |
|
Year |
(million m3) |
(million m3) |
(million m3) |
(million m3) |
(million m3) |
(million m3) |
(million m3) |
2000 |
92.0 |
14.3 |
106.4 |
27.9 |
16.6 |
24.2 |
175.1 |
2001 |
93.1 |
13.9 |
107.0 |
24.3 |
15.2 |
24.0 |
170.6 |
2002 |
97.9 |
12.8 |
110.7 |
22.7 |
15.7 |
27.1 |
176.3 |
2003 |
101.2 |
12.2 |
113.4 |
21.1 |
15.4 |
27.0 |
176.9 |
2004 |
108.8 |
12.5 |
121.3 |
20.8 |
17.1 |
33.9 |
193.0 |
2005 |
115.8 |
12.9 |
128.7 |
19.8 |
17.9 |
30.7 |
197.2 |
2006 |
106.8 |
14.5 |
121.3 |
18.8 |
18.9 |
26.4 |
185.4 |
2007 |
89.4 |
15.5 |
105.0 |
17.9 |
20.2 |
24.1 |
167.2 |
2008‡ |
61.1 |
15.8 |
76.9 |
16.9 |
20.2 |
22.3 |
136.3 |
2009‡ |
44.8 |
14.4 |
59.2 |
16.5 |
20.2 |
11.9 |
107.8 |
*Includes new construction, mobile homes, and improvements and repairs.
†Includes activities not captured in specific end-use markets, and adjustments to compensate for inherent differences between total consumption and the sum of its parts.
‡Preliminary data.
Sources: C. Adair, Market Outlook: Structural Panels and Engineered Wood Products 2009–2014, American Plywood Association, Tacoma, WA, 2009; D. B. McKeever, Estimated Annual Timber Products Consumption in Major End Uses in the United States, 1950–2006, No. FPL-GTR-181, USDA Forest Service/Forest Products Laboratory, Madison, WI, 2009; U.S. Census Bureau: Manufacturing, Mining, and Construction Statistics, 2010.
Despite the recent economic downturn, wood products remain vital to the strength and well-being of the U.S. economy and will continue to be important as the economy recovers and grows in the future. Construction is by far the largest consumer of wood products. Historically, it has accounted for about two-thirds of total solid wood products consumption, about half of which is new residential construction. Information on consumption in nonresidential end-use markets provides important insights into the strength of the market and into how factors affecting the market can impact consumption.
For example, nonresidential construction was fairly unscathed by the initial impact of the recent recession. Nonresidential construction typically takes years to complete rather than months for residential construction. Many projects were in progress during the beginning of the recession. Consumption for nonresidential construction peaked in 2008 and now appears to be in a slow decline, but not as precipitous as the decline in residential construction (Table 2).
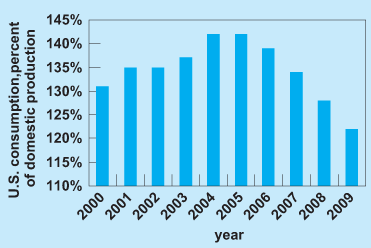
The United States has been a net importer of solid wood and composite wood products for decades, but imports have also dropped precipitously as consumption declined in recent years. In periods of robust economic growth, domestic demands far exceed domestic production, allowing imports to increase. However, during a slow economy, domestic production reclaims a larger share of consumption. Whereas total consumption of solid wood and composite wood products exceeded domestic production by 31% in 2000 and by 42% in 2005, this percentage dropped to just 22% in 2009 (Fig. 4). Thus, domestic producers have reclaimed a larger share of the U.S. wood products market.
Trends in timber growth and removals
Just as timber market trends are never static but rather constantly changing, so too are trends in timber growth and timber supply. As U.S. timber demand and harvest levels have moderated in recent years, U.S. timber growth and timber inventories have increased. Timber inventories are the volumes of standing timber on commercial forest land. Figure 5 shows trends since the 1980s in net annual growth of timber growing stock (average net change in the volume of forest growing stock inventory) and timber growing stock removals on U.S. timberland (total private and public timberland), as reported by the U.S. Forest Service. [Note that U.S. timberland is defined as all forest land producing or capable of producing industrial wood (at least 20 cubic feet per acre per year) and not withdrawn from production by statute or regulation, including both private and public timberland. Timber growing stock is a classification of timber inventory that includes live commercial species of trees meeting specified standards of quality and vigor (it excludes dead trees or cull trees). Removals include the growing stock removed by timber product harvest (including logging residues) and other removals such as land clearing and stand thinning (harvest and logging residues accounted for 92% of removals in 2006).]
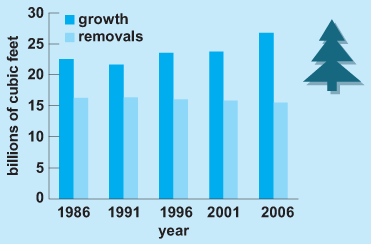
If net annual growth equaled annual removals, there would be an exact balance between tree removal volumes, tree mortality, and tree growth. However, since net annual growth is increasing and is much larger than annual removals, the data indicate that timber inventory is increasing, as timber growth is far ahead of timber removals. In fact, U.S. timber growing stock inventory has increased from 755,935 million cubic feet in 1987 to 932,096 million cubic feet in 2007, an increase of 23% in 20 years, at an average rate of 9 billion cubic feet per year, and the rate of accumulation has been increasing in recent years. It should be noted that this increase is largely the result of increased volumes per acre, not increased acreage of forest land. Total forest land has been fairly stable over the past 25 years or more. The U.S. timber growing stock inventory is now 51% higher than in 1953, when it was 615,884 million cubic feet.
Trends in real prices for timber
Real (inflation-adjusted) price indexes are indicators of relative economic scarcity or economic abundance for any commodity. [Real price indexes are computed by adjusting nominal price indexes for inflation, in this case by dividing producer price indexes for timber commodities by the all-commodity producer price index (using nationwide price index data as reported by the U.S. Bureau of Labor Statistics).] Figure 6 shows U.S. nationwide real price indexes for several timber commodities, including softwood logs and bolts, hardwood logs and bolts, and pulpwood. Although timber commodity prices have experienced some volatility in recent decades, the overall trends in real prices have been generally declining since the mid-1990s, which tends to indicate abundance of timber supply relative to timber demand. Timber supply indicates the volumes of timber that owners are willing to sell at differing price levels, whereas timber demand indicates the volumes of timber that buyers are willing to purchase at differing price levels.
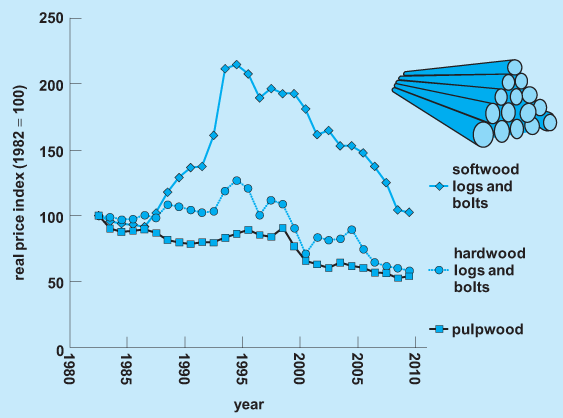
Softwood logs experienced a sharp price spike in the late 1980s and early 1990s, largely because of administrative reductions in timber harvests from national forests and other public lands (particularly in the U.S. West). However, after peaking in the early 1990s, the real price index for softwood logs and bolts declined, and the index is currently at a level nearly the same as in the early 1980s. Meanwhile, real price indexes did not increase as much for hardwood logs and bolts, or for pulpwood, and those price indexes have also substantially declined with declining demands since the 1990s. In fact, they are now at levels well below price levels of the 1980s in real (inflation-adjusted) terms (Fig. 6). These changes indicate that timber supply growth has far outpaced domestic demand growth since the early 1990s, which resulted from a declining paper and paperboard sector, a declining manufacturing sector (particularly furniture manufacturing, which has moved largely offshore), and increased importation of softwood lumber. These factors all contributed to increased accumulation of timber inventories (a contributing factor in supply growth).
Conclusions
The United States is the world's leading producer of primary forest products, including wood pulp, lumber, and wood panel products. In 2008, the United States accounted for 17% of worldwide lumber, plywood, and particleboard production, down from 25% a decade earlier, and 21% of worldwide paper and paperboard production, down from 29% a decade earlier. Those products serve a wide array of end users in commercial activities ranging from packaging, shipping, warehousing, publishing, personal care, and hygiene to housing construction, manufacturing, and transportation. As such, sustaining adequate supply of timber for those primary products is economically and commercially an important element in sustaining the economic vitality, competitiveness, and future growth of the U.S. economy. However, growth in timber demand has diminished in recent years, and concern that wood supply is out of balance with wood demand should give way to a new perspective. Real prices for timber commodities have been declining for many years (at least since the 1990s), a clear reflection of the fact that timber supply and timber growth are outpacing timber demand. From a resource perspective, trends indicate that U.S. timber demands have become much more sustainable in relation to timber supply, with annual timber growth expanding its lead over annual timber harvest volume, and standing timber inventories reaching levels higher than at any time in at least the past 60 years or more.
See also: Forest and forestry; Forest management; Forest measurement; Forest timber resources; Lumber; Paper; Reforestation; Wood processing; Wood products


