Key Concepts
A multidisciplinary field for analyzing large amounts of data—current and past (historical)—which are processed using tools and methods from statistics, applied mathematics, artificial intelligence, and computer programming, with the object of generating results that can support decision management.
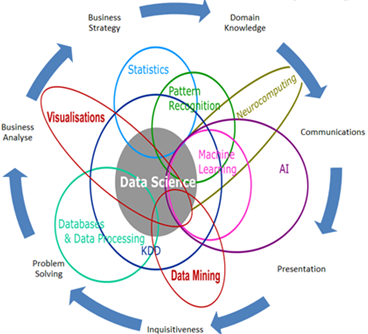
Structured data (relational databases), unstructured data (audio, text, and video), or a combination of these can be analyzed. Data scientists require a large range of expertise and skills to understand, analyze, and break a problem into solvable units (Fig. 1). However, it is very difficult for any individual to have and master all of those skills. In data science, it is necessary to work in interdisciplinary groups with expertise in statistics, pattern recognition, machine learning, databases, and visualizations. Because of the diversity and nature of the data, its volume, generation speed, and the type of decision management that is necessary for support, it is critical to select the correct model for analyzing the data. Whenever possible, it is important to present the data analysis visually. See also: Artificial intelligence; Computer programming; Database management system; Machine learning; Statistics

Need for data science
The use of technology has changed the realm of big data and hence of data science. On average, most technology users own at least two devices that can be connected to the Internet. These devices receive and generate vast amounts of data, generally through the use of social media. It is estimated that over 2.5 quintillion (1018) bytes of data are created every day. Data can be analyzed to create meaningful insights that may be used to support real-time decision making (as in the stock market) or as part of a future strategy or scientific endeavor. In this sense, it is necessary to understand that data are an asset for organizations. For example, collection and analysis of weather data can help predict atmospheric phenomena such as hurricanes, thunderstorms, and tornadoes. Data gathered about catastrophic consequences of atmospheric phenomena can be analyzed and used to allow business and first responders to have ready the supplies necessary to assist the populations affected. For example, Walmart analyzed the data it had collected after Hurricane Charlie (August 9–15, 2004) to stock its stores in anticipation of the landfall of Hurricane Frances (August 24, 2004, to September 10, 2004). In medicine, patient data collected by doctors and researchers are used to generate models to predict the best treatments, or for accurate diagnoses. Data analysis of medication side effects can assist doctors in prescribing, or avoiding, a particular medication. See also: Big data; Internet; Social media
Project life cycle
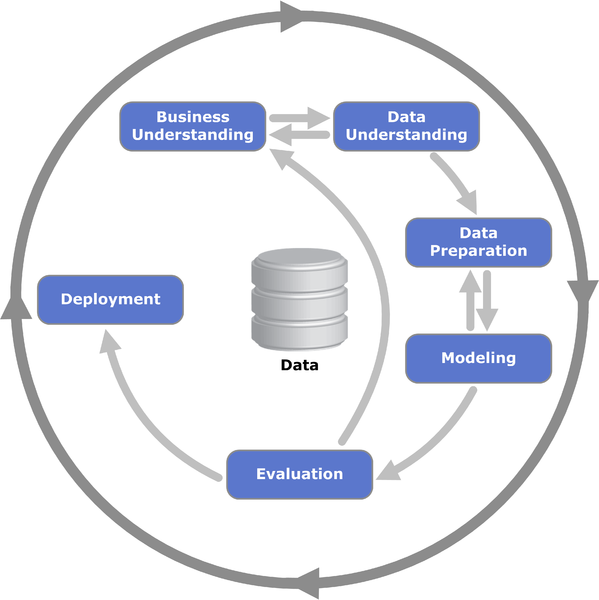
Data-driven projects, such as those of data science or engineering, require a workflow of activities or steps (project life cycle). These activities consist of phases. Any of the traditional life-cycle methodologies of software engineering, such as Waterfall, RAPID, and Agile, can be used in a data-science project. The life cycle of a typical data science project consists of four phases or steps (Fig. 2): business and data understanding, data preparation, modeling and evaluation, communication of results. The last step is not explicitly shown in Fig. 2. See also: Software engineering

Business and data understanding
As Fig. 2 suggests (as seen by the direction of the arrows), a typical data-science life cycle is an iterative process. There may be many back-and-forth interactions between two consecutive phases or two nonconsecutive phases during which data may be sent “back” to a previous phase for further formatting or refinement. Different specialists may work on each of these phases and, depending on the nature of the data, their numbers may range from individuals to entire departments. The business and data understanding phase of the life cycle involves the entire organization, because it is necessary to ensure that the data are available at every level required, and that the data have a single view within the organization. There should be no conflict in how the data are perceived and used by the different units of the organization. For example, if the data are numerical and need to be expressed in units such as miles, no piece of data should be expressed in other units, such as kilometers or yards. At this initial stage, the data sources need to be identified and agreed on.
Data preparation
Although not shown explicitly in Fig. 2, the next phase of a data-science project consists of capturing, scrubbing, and processing the data.
Capturing
Once the data have been identified and agreed on, the next step is data capture (collection). Data, which may be available from many different external sources, are collected mostly by automatic means, and rarely by manual means. Data can also be extracted from an organization’s existing (historical) data, which may not be in use currently. If the data are not available internally or are difficult to capture, the data may be purchased from similar organizations. In addition, having more data is not always helpful, unless the data are both relevant and accurate. For the problem at hand, it is important to identify clearly the data that need to be captured as well as the pertinent data attributes or characteristics.
Scrubbing
Intuitively, after collecting the data, we would expect to analyze it immediately. However, that is often not the case. Before they can be analyzed, the data need to be cleansed, because they may be incomplete, invalid, irrelevant, or in an incompatible format. After the data have been processed to a form that is consistent and coherent, they are ready for analysis. If the data are not in the appropriate format, or are irrelevant, analysis will not provide meaningful information.
Processing
After scrubbing (cleansing), the data are summarized, or combined in a convenient form, before further processing using aggregation, clustering, or classification techniques. Based on the nature of the data (quantitative or qualitative), decisions must be made on how to group the data.
Modeling and evaluating
To make use of the data, a mathematical model or several models may be created. A model will have as its input a large amount of the data collected. Depending on the nature of the type of decision(s) that management seeks, the model may be used as a classifier (such as accept/reject or buy/sell) for finding data with similar characteristics (clusters) or for making predictions (regression). Models can be designed for handling different types of data, including quantitative, qualitative, text, or combinations of these types. A large portion of the data is input to “train” the model. Training involves (1) developing the procedure for solving a problem (algorithm) and (2) analyzing the algorithm’s output. Once the algorithm produces output that is consistent with expected results, the model is validated. That is, the algorithm’s output agrees with the remaining input data available. In other words, of all the data initially available, if we use some of the data that were left out, will the algorithm tell us what we already know? For example, suppose an organization wants to predict whether its clients will renew their contracts (churn problem). If the organization has client data (such as salary, marital status, and employment history), it may use that information to create a model. If historical data (such as information about the clients who renewed their contracts and those who did not) are available, some of that data might be used to see whether the model can predict what is already known from the data. For instance, if it is known that a client did not renew, will the model make the same prediction? See also: Algorithm; Data reduction; Model theory
When testing a model, it may be necessary to define a “threshold” to determine its accuracy and reliability. For instance, a threshold of 90% of “hits” (in which the model agrees with what we already know from the data) could be set to deem the model acceptable. If the model does not meet this threshold it is sent “back” to the appropriate phase to be redefined (tuned). The process of testing and tuning the model may recur several times until the model meets the required threshold. During this process, the model should not be overfit (that is, trained with the entire data). If it is overfit, the model will make correct predictions because it has already seen the input data. However, the same model, when presented with different, but similar, data might fail drastically to predict what we already know. A model can also be underfitted (that is, there are not enough data to train the model to make predictions). In this phase of designing or evaluating the model, more than one model may be under consideration. These models may or may not complement each other.
Communicating
Once the models are validated and deployed, a final step in the life cycle is necessary (although not shown in Fig. 2). Remember that a data-science project’s ultimate objective is to aid the decision-management process. That is, eventually a decision needs to be made using the modeling results. To achieve this objective, the information provided by the model needs to be communicated in a manner that makes sense to the decision makers. Therefore, presentation and communication of the data are critical. There may be different levels of presentation. For example, sales may be analyzed for comparison among different sales territories. However, should management find it necessary, the presentation can shift to individual districts within the territory. Requests for comparison may extend to cities, subdivisions, or individual businesses. In other words, whenever possible and if the media allows, the presentation should allow for “drilling down” into the data. At any level of the presentation or analysis, the data should be meaningful and relevant. There are various ways to present the results of a model, such as binary trees, dashboards, data graphs, histograms, and bar charts. This phase routinely includes data reporting, which may also require different types or levels of presentation.
Data scientist versus data analyst versus data engineer
Although statisticians, actuaries, and mathematicians may claim that they are doing data science, the responsibilities of data scientists, data analysts, and data engineers are not well defined. Data engineers work on capturing and scrubbing data. Data analysts work with the data and the various tools available. However, some data analysts may not have programming skills, reinforcing the need for a multidisciplinary collaboration. Throughout the entire life cycle, data analysts sift through data and provide reports and visualizations to explain what insights the data may be hiding. Data analysts may require the assistance of domain experts to understand their findings or the assistance of visualization experts to select the appropriate tool for presenting the data in the most meaningful way. Data engineering sometimes includes the activities of the data analyst, but data engineering concentrates more on the programming aspects of the algorithms and manipulation of the data. No matter how good a programmer, mathematician, or statistician one may be, it is certain that no individual has all the skills required that fall under the umbrella of a data scientist.
Tools
At present, the top skill in programming for data analysis is proficiency in at least one of three programming languages: Python, R, and SQL. Python and R are general programming languages, whereas SQL is an English-like programming language for retrieving and analyzing data. Other popular proprietary tools are Tableu, Amazon Web Services (AWS), TensorFlow, NoSQL, and Hadoop. TensorFlow is a computational framework for building machine-learning models for solving complex problems such as image classification, object recognition, and sound recognition. For nonprogrammers, the tools available are Rapid Miner, Data Robot, Trifacta, IBM Watson Studio, Amazon Lex. See also: Software
Challenges in data science
There is no shortage of data. However, most of the data are scattered. In addition, the volume and the speed at which data are being generated is overwhelming. The main challenge is to collect data so that they can be presented in a unified view to provide enriching information, with the objective of making the most informative decision possible. Consider, for example, the analysis in real time of an issue followed by millions of Twitter users. Such social-media analyses generate challenges never raised before. This leads us to the recognition that a good project requires a combination of storytelling and data analysis, which will allow one to formulate clearly what are the questions that the business or scientific enterprise is trying to address (business understanding and data understanding). In the case of a business, the main objective might be predicting client retention (churn problem). In the case of science, the objective might be predicting weather phenomena and consequences (forecasting). Data science requires the analysis of huge volumes of data and presents many challenges, including dirty data, lack of data-science talent in an organization, lack of a clear question related to the available data, unavailable or difficult-to-access data, presentation, and privacy issues. See also: Weather forecasting and prediction
Data science may have its challenges, but the enormity of data creates the need for its analysis. Therefore, it is important to understand the algorithms and tools required to analyze and visualize the data in a meaningful way.


