The bending of light, or other waves, into the region of the geometrical shadow of an obstacle. More exactly, diffraction refers to any redistribution in space of the intensity of waves that results from the presence of an object that causes variations of either the amplitude or phase of the waves. Most diffraction gratings cause a periodic modulation of the phase across the wavefront rather than a modulation of the amplitude. Although diffraction is an effect exhibited by all types of wave motion, this article will deal only with electromagnetic waves, especially those of visible light. Some important differences that occur with microwaves will also be mentioned. For discussion of the phenomenon as encountered in other types of waves See also: Electromagnetic wave; Electron diffraction; Neutron diffraction; Sound
Diffraction is a phenomenon of all electromagnetic radiation, including radio waves; microwaves; infrared, visible, and ultraviolet light; and x-rays. The effects for light are important in connection with the resolving power of optical instruments. See also: Radio-wave propagation; X-ray diffraction
There are two main classes of diffraction, which are known as Fraunhofer diffraction and Fresnel diffraction. The former concerns beams of parallel light, and is distinguished by the simplicity of the mathematical treatment required and also by its practical importance. The latter class includes the effects in divergent light, and is the simplest to observe experimentally. A complete explanation of Fresnel diffraction has challenged the most able physicists, although a satisfactory approximate account of its main features was given by A. Fresnel in 1814. At that time, it played an important part in establishing the wave theory of light.
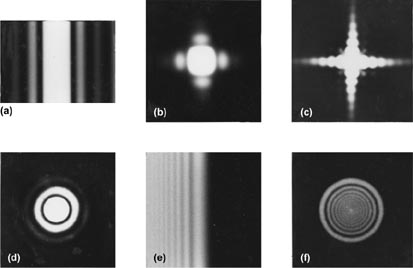
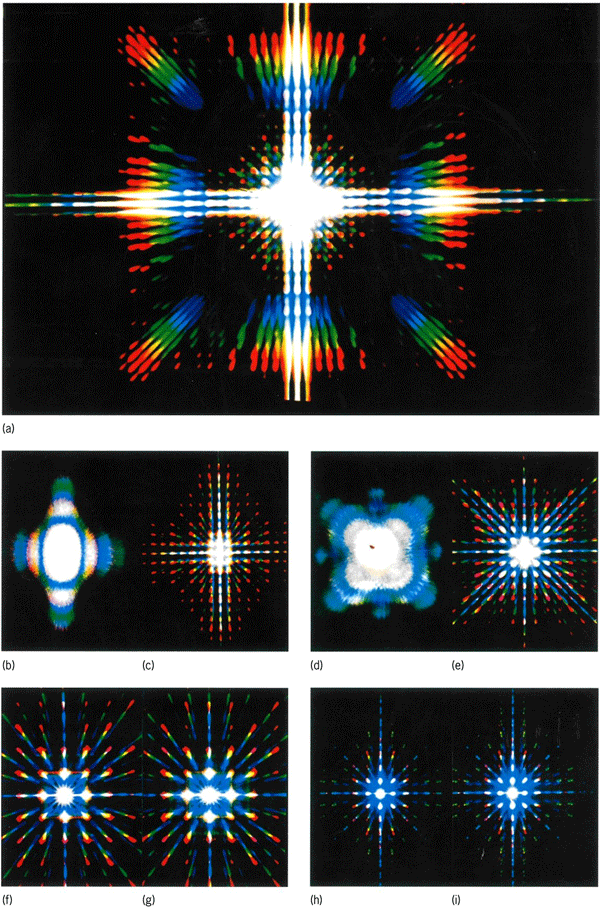
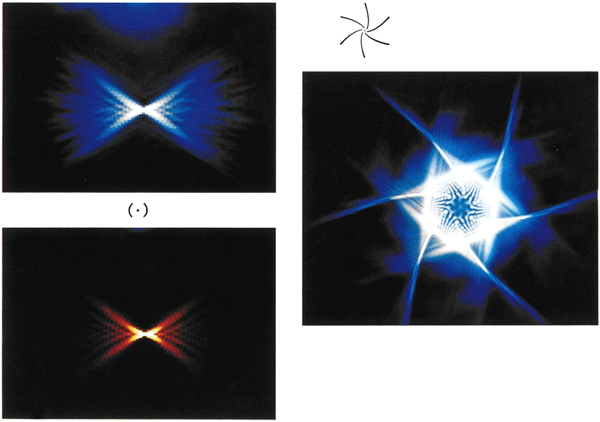
To illustrate the difference between methods of observation of the two types of diffraction, Fig. 1 shows the experimental arrangements required to observe them for a circular hole in a screen s. The light originates at a very small source O, which can conveniently be a pinhole illuminated by sunlight. In Fraunhofer diffraction, the source lies at the principal focus of a lens L1, which renders the light parallel as it falls on the aperture. A second lens L2 focuses parallel diffracted beams on the observing screen F, situated in the principal focal plane of L2. In Fresnel diffraction, no lenses intervene. The diffraction effects occur chiefly near the borders of the geometrical shadow, indicated by the broken lines. An alternative way of distinguishing the two classes, therefore, is to say that Fraunhofer diffraction concerns the effects near the focal point of a lens or mirror, while Fresnel diffraction concerns those effects near the edges of shadow. Photographs of some diffraction patterns of each class are shown in Figs. 2–4. All of these may be demonstrated especially well by using the light beam from a neon-helium laser. See also: Laser

Fraunhofer Diffraction
This class of diffraction is characterized by a linear variation of the phases of the Huygens secondary waves with distance across the wavefront, as they arrive at a given point on the observing screen. At the instant that the incident plane wave occupies the plane of the diffracting screen, it may be regarded as sending out, from each element of its surface, a multitude of secondary waves, the joint effect of which is to be evaluated in the focal plane of the lens L2. The analysis of these secondary waves involves taking account of both their amplitudes and their phases. The simplest way to do this is to use a graphical method, the method of the vibration curve, which can readily be extended to cases of Fresnel diffraction. See also: Huygens' principle
Vibration curve
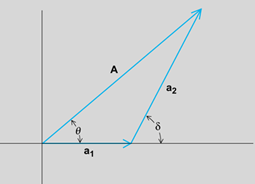
The basis of the graphical method is the representation of the amplitude and phase of a wave arriving at any point by a vector, the length of which gives the magnitude of the amplitude, and the slope of which gives the value of the phase. In Fig. 5 are shown two vectors of amplitudes a1 and a2, pertaining to two waves having a phase difference δ of 60°. That is, the waves differ in phase by one-sixth of a complete vibration. The resultant amplitude A and phase θ (relative to the phase of the first wave) are then found from the vector sum of a1 and a2, as indicated. A mathematical proof shows that this proposition is rigorously correct and that it may be extended to cover the addition of any number of waves.
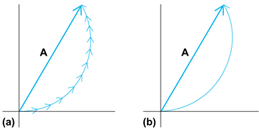
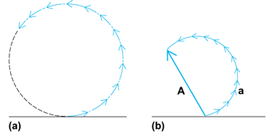
The vibration curve results from the addition of a large (really infinite) number of infinitesimal vectors, each representing the contribution of the Huygens secondary waves from an element of surface of the wavefront. If these elements are assumed to be of equal area, the magnitudes of the amplitudes to be added will all be equal. They will, however, generally differ in phase, so that if the elements were small but finite each would be drawn at a small angle with the preceding one, as shown in Fig. 6a. The resultant of all elements would be the vector A. When the individual vectors represent the contributions from infinitesimal surface elements (as they must for the Huygens wavelets), the diagram becomes a smooth curve, the vibration curve, shown in Fig. 6b. The intensity on the screen is then proportional to the square of this resultant amplitude. In this way, the distribution of the intensity of light in any Fraunhofer diffraction pattern may be determined.
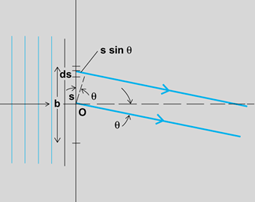
The vibration curve for Fraunhofer diffraction by screens having slits with parallel, straight edges is a circle. Consider, for example, the case of a slit of width b illustrated in Fig. 7. The edges of the slit extend perpendicular to the plane of the figure, and the slit is illuminated by plane waves of light coming from the left. If s is the distance from O of a surface element ds (ds actually being a strip extending perpendicular to the figure), the extra distance wavelet from ds must travel in reaching a point on the screen lying at the angle θ from the center is s sin θ. Since this extra distance determines the phase difference, the latter varies linearly with s. This condition necessitates that the vibration curve be a circle.
The intensity distribution for Fraunhofer diffraction by a slit as a function of the angle θ may be simply calculated as follows. The extra distances traveled by the wavelets from the upper and lower edges of the slit, as compared with those from the center, are +(b/2) sin θ and −(b/2) sin θ. The corresponding phase differences are 2π/λ times these quantities, λ being the wavelength of the light. Using the symbol β for (πb sin θ)/λ, it is seen that the end points of the effective part of the vibration curve must differ in slope by ±β from the slope at its center, where it is taken as zero. Figure 8 shows the form of the vibration curve for β = π/4, that is for sin θ = ¼λb. The resultant is sin β, where r is the radius of the arc. The amplitude A0 that would be obtained if all the secondary waves were in phase at the center of the diffraction pattern, where θ = 0, is the length of the arc. Thus, Eq. (1)
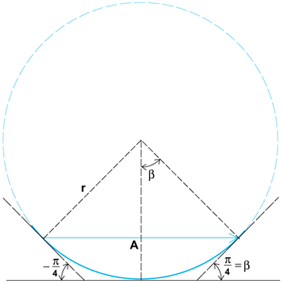
holds. The intensity at any angle is given by Eq. (2),
where I0 is the intensity at the center of the pattern. Figure 9 shows a graph of this function. The central maximum is twice as wide as the subsidiary ones, and is about 21 times as intense as the strongest of these. A photograph of this pattern is shown in Fig. 2a.
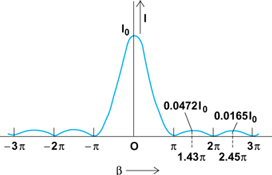
The dimensions of the pattern are important, since they determine the angular spread of the light behind the slit. The first zeros occur at values β = (πb sin θ)/λ = ±π. In most cases the angle θ is extremely small, so that Eq. (3)
holds. For a slit 1 mm wide, for example, and green light of wavelength 5 × 10⁻⁵ cm, Eq. (3) gives the angle as only 0.0005 radian, or 1.72 minutes of arc. The slit would have to be much narrower than this, or the wavelength much longer, for the approximation to cease to be valid.
The main features of Fraunhofer diffraction patterns of other shapes can be understood with the aid of the vibration curve. Thus for a rectangular or square aperture, the wavefront may be subdivided into elements parallel to either of two adjacent sides, giving an intensity distribution which follows the curve of Fig. 9 in the directions parallel to the two sides. Photographs of such patterns appear in Fig. 2b and c. In Fig. 2c it will be seen that there are also faint subsidiary maxima lying off the two principal directions. These have intensities proportional to the products of the intensities of the side maxima in the slit pattern. The fact that these subsidiary intensities are extremely low compared with that of the central maximum has an important application to the apodization of lenses, to be discussed later.
Diffraction grating
An idealized diffraction grating consists of a large number of similar slits, equally spaced. Equal segments of the vibration curve are therefore effective, as shown in Fig. 10a. The resultants a of each segment are then to be added to give A, the amplitude due to the whole grating, as shown in Fig. 10b. The phase difference between successive elements is here assumed to be very small. As it is increased, by going to a larger angle θ, the resultant A first goes to zero at an angle corresponding to λ/W, where W is the total width of the grating. After going through numerous low-intensity maxima, A again rises to a high value when the phase difference between the successive vectors for the individual slits approaches a whole vibration. These small vectors a are then all lined up again, as they were at the center of the pattern (θ = 0). The resulting strong maximum represents the “first-order spectrum,” since its position depends on the wavelength. A similar condition occurs when the phase difference becomes two, three, or more whole vibrations, giving the higher-order spectra. By means of this diagram, it is possible not only to predict the intensities of successive orders for an ideal grating, but also to find the sharpness of the maxima which represent the spectrum lines. See also: Diffraction grating
Determination of resolving power
Fraunhofer diffraction by a circular aperture determines the resolving power of instruments such as telescopes, cameras, and microscopes, in which the width of the light beam is usually limited by the rim of one of the lenses. The method of the vibration curve may be extended to find the angular width of the central diffraction maximum for this case. Figure 11 compares the treatments of square and circular apertures by showing, above, the elements of equal phase difference into which the wavefront may be divided, and, below, the corresponding vibration curves. For the square aperture shown in Fig. 11a, the areas of the surface elements are equal, and the curve forms a complete circle at the first zero of intensity. In Fig. 11b these areas, and hence the lengths of the successive vectors, are not equal, but increase as the center of the curve is approached, and then decrease again. The result is that the curve must show somewhat greater phase differences at its extremes in order to form a closed figure. An exact construction of the curve or, better, a mathematical calculation shows that the extreme phase differences required are ±1.220π, yielding Eq. (4)
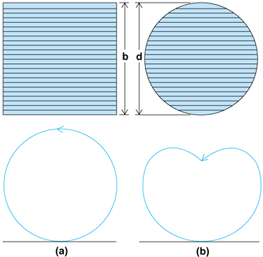
for the angle θ at the first zero of intensity. Here d is the diameter of the circular aperture. When this result is compared with that of Eq. (3), it is apparent that, relative to the pattern for a rectangle of side b = d, this pattern is spread out by 22%. Obviously it now has circular symmetry and consists of a diffuse central disk, called the Airy disk, surrounded by faint rings (Fig. 2d). The angular radius of the disk, given by Eq. (4), may be extremely small for an actual optical instrument, but it sets the ultimate limit to the sharpness of the image, that is, to the resolving power. See also: Resolving power (optics)
Other applications
Among the applications of Fraunhofer diffraction, other than the calculation of resolving power, are its use in (1) the theory of certain types of interferometers in which the interfering light beams are brought together by diffraction, (2) the theory of microscopic imaging, and (3) the design of apodizing screens for lenses.
Michelson's stellar interferometer
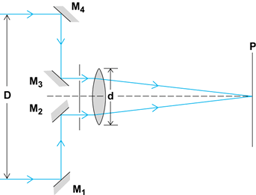
This instrument was devised by A. A. Michelson to overcome the limitation expressed by Eq. (4). In front of a telescope are placed two fixed mirrors, shown at M2 and M3 in Fig. 12, and two others, M1 and M4, movable so as to vary their separation D. The light of a star is directed by these mirrors into a telescope as shown, and the diffraction patterns, of size corresponding to the aperture of the mirrors, are superimposed in the focal plane P of the lens. When D is small the resulting pattern is crossed by interference fringes. If the light source has a finite width, increasing D causes these fringes to become indistinct and eventually to disappear. For a circular disk source, such as a star, the angle subtended by the disk must be 1.22λ/D for the disappearance of the fringes. The resolving power of the telescope has thus effectively been increased in the ratio D/d. In this way angular diameters as small as 0.02 second of arc have been measured, corresponding to D = 7 m or 24 ft. See also: Interference of waves; Interferometry
Microscopic imaging
E. Abbe's theory of the microscope evaluates the resolving power of this instrument considering not only the diffraction caused by the limited aperture of the objective, but also that caused by the object itself. If this object is illuminated by coherent light, such as a parallel beam from a point source, its Fraunhofer diffraction pattern is formed in the rear focal plane of the microscope objective. Abbe took as an object a diffraction grating, and in this case the pattern consists of a series of sharp maxima representing the various orders m = 0, ±1, ±2, …. If the light of all these orders is collected by the objective, a perfect image of the grating can be formed where the light is reunited in the image plane. In practice, however, the objective can include only a limited number of them, as is indicated in Fig. 13. Here only the orders +2 to −2 are shown entering the objective. The higher orders, involving greater values of θ, would miss the lens.
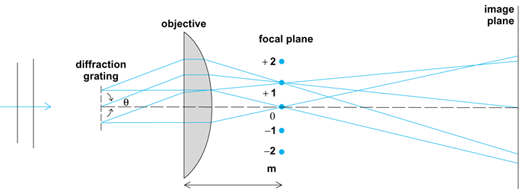
The final image must be produced by interference in the image plane of the Huygens secondary waves coming from the various orders. To obtain a periodic variation of intensity in that plane, at least two orders must be accepted by the objective. The angle θ1 at which the first order occurs is given by sin θ1 = λ/d, where d is the spacing of the lines in the grating. The limit of resolution of the microscope, that is, the smallest value of d that will produce an indication of separated lines in the image, may thus be found from the angular aperture of the objective. In order for it to accept only the orders 0, ±1, the lens aperture 2α must equal at least 2θ1, giving α. This resolving limit may be decreased by illuminating the grating from one side, so that the zero-order light falls at one edge of the lens, and that of one of the first orders at the other edge. Then θ1 = 2α, and the limit of resolution is approximately 0.5λ/sin α. See also: Optical microscope
Apodization
This is the name given to a procedure by which the effect of subsidiary maxima (such as those shown in Fig. 9) may be partially suppressed. Such a suppression is desirable when one wishes to observe the image of a very faint object adjacent to a strong one. If the fainter object has, for example, only 1/1000 of the intensity of the stronger one, the two images will have to be far enough apart so that the principal maximum for the fainter one is at least comparable in intensity to the secondary maxima for the stronger object at that point. In the pattern of a rectangular aperture it is not until the tenth secondary maximum that the intensity of the secondary maxima falls below 1/1000 of the intensity of the principal maximum. Here it has been assumed, however, that the fainter image lies along one of the two principal directions of diffraction of the rectangular aperture, perpendicular to two of its adjacent sides. At 45° to these directions the subsidiary maxima are much fainter (Fig. 2c), and even the second one has an intensity of only 1/3700, the square of the value of the second subsidiary maximum indicated in Fig. 9.
The simplest apodizing screen is a square aperture placed over a lens, the diagonal of the square being equal to the diameter of the lens. If the lens is the objective of an astronomical telescope, for example, the presence of a fainter companion in a double-star system can often be detected by turning the square aperture until the image of the companion star lies along its diagonal. Apodizing screens may be of various shapes, depending on the purpose to be achieved. It has been found that a screen of graded density, which shades the lens from complete opacity at the rim to complete transparency at a small distance inward, is effective in suppressing the circular diffraction rings surrounding the Airy disk. In all types of apodization there is some sacrifice of true resolving power, so that it would not be used if the two images to be resolved were of equal intensity.
Fresnel Diffraction
The diffraction effects obtained when the source of light or the observing screen are at a finite distance from the diffracting aperture or obstacle come under the classification of Fresnel diffraction. This type of diffraction requires for its observation only a point source, a diffracting screen of some sort, and an observing screen. The latter is often advantageously replaced by a magnifier or a low-power microscope. The observed diffraction patterns generally differ according to the radius of curvature of the wave and the distance of the point of observation behind the screen. If the diffracting screen has circular symmetry, such as that of an opaque disk or a round hole, a point source of light must be used. If it has straight, parallel edges, it is desirable from the standpoint of brightness to use an illuminated slit parallel to these edges. In the latter case, it is possible to regard the wave emanating from the slit as a cylindrical one. For the purpose of deriving the vibration curve, the appropriate way of dividing the wavefront into infinitesimal elements is to use annular rings in the first case, and strips parallel to the axis of the cylinder in the second case.
Figure 14 illustrates the way in which the radii of the rings, or the distances to the edges of the strips, must be chosen in order that the phase difference may increase by an equal amount from one element to the next. Figure 14a shows a section of the wavefront diverging from the source S, and the paths to the screen of two secondary wavelets. The shortest possible path is b, while r is that for another wavelet originating at a distance s above the “pole” O. Since all points on the wavefront are at the same distance a from S, the path difference between the two routes from S to P is r − b. When this is evaluated, to terms of the first order in s/a and s/b, the phase difference is given by Eq. (5).
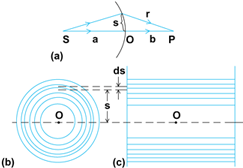
The phase difference across an elementary zone of radius s and width ds then becomes dδ = 2Csds, so that for equal increments of δ the increment of s must be proportional to 1/s. The annular zones and the strips drawn in this way on the spherical or cylindrical wave, respectively, looking toward the pole from the direction of P, are shown in Fig. 14b and c.
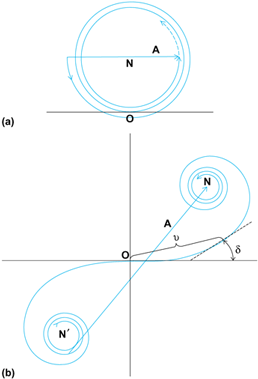
For the annular zonal elements, the areas 2πsds are all equal, and hence the amplitude elements of the vibration curve should have the same magnitude. Actually, they must be regarded as falling off slowly, due to the influence of the “obliquity factor” of Huygens' principle. The resulting vibration curve is nearly, but not quite, circular, and is illustrated in Fig. 15a. It spirals in toward the center C, at a rate that has been considerably exaggerated in the figure. The intensity at any point P on the axis of a circular screen centered on O can now be determined as the square of the resultant amplitude A for the appropriate part or parts of this curve. The curve shown in Fig. 15a is for a circular aperture which exposes five Fresnel zones, each one represented by a half-turn of the spiral. The resultant amplitude is almost twice as great (and the intensity four times as great) as it would be if the whole wave were exposed, in which case the vector would terminate at C. The diffraction by other circular screens may be determined in this same manner.
Zone plate
This is a special screen designed to block off the light from every other half-period zone, and represents an interesting application of Fresnel diffraction. The Fresnel half-period zones are drawn, with radii proportional to the square roots of whole numbers, and alternate ones are blackened. The drawing is then photographed on a reduced scale. When light from a point source is sent through the negative, an intense point image is produced, much like that formed by a lens. The zone plate has the effect of removing alternate half-turns of the spiral, the resultants of the others all adding in the same phase. By putting δ = π and a = ∞ in Eq. (5), it is found that the “focal length” b of a zone plate is s12/λ, where s1 is the radius of the first zone.
Cornu's spiral
This is the vibration curve for a cylindrical wavefront, and is illustrated in Fig. 15b. The areas of the elementary zones, and hence the magnitudes of the component vectors of the vibration curve, decrease rapidly, being proportional to ds, and hence to 1/s (Fig. 14c). The definition of Cornu's spiral requires that its slope δ at any point be proportional to the square of the corresponding distance s measured up the wavefront [Fig. 14a and Eq. (5)]. The length of the spiral from the origin is proportional to s, but it is usually drawn in terms of the dimensionless variable υ, defined by υ = s in the notation of Eq. (5). The coordinates of any point on the curve may then be found from tables of Fresnel's integrals.
As an example of the application of Cornu's spiral, consider the diffraction of an opaque straight edge, such as a razor edge, illuminated by light from a narrow slit parallel to the edge. At some point outside the edge of the shadow, say one which exposes three half-period strips beyond the pole, the resultant amplitude will be that labeled A in Fig. 15b. The intensity will be greater than that given by the amplitude NN′, which represents the amplitude for the whole (unobstructed) wave. On going further away from the edge of the shadow, the tail of the vector A will move along the spiral inward toward N′, and the intensity will pass through maxima and minima. At the edge of the geometrical shadow the amplitude is ON, and the intensity is just one-fourth of that due to the unobstructed wave. Further into the shadow the intensity approaches zero regularly, without fluctuations, as the tail of the vector moves up toward N. A photograph of the straight-edge pattern is shown in Fig. 2e.
Babinet's principle
This states that the diffraction patterns produced by complementary screens are identical. Two screens are said to be complementary when the opaque parts of one correspond to the transparent parts of the other, and vice versa. Babinet's principle is not very useful in dealing with Fresnel diffraction, except that it may furnish a short-cut method in obtaining the pattern for a particular screen from that of its complement. The principle has an important application for Fraunhofer diffraction, in parts of the field where there is zero intensity without any screen. Under this condition the amplitudes produced by the complementary screens must be equal and opposite, since the sum of the effects of their exposed parts gives no light. The intensities, being proportional to the squares of the amplitudes, must therefore be equal. In Fraunhofer diffraction the pattern due to a disk is the same as that due to a circular hole of the same size.
Diffraction of Microwaves
The diffraction of microwaves, which have wavelengths in the range of millimeters to centimeters, has been intensively studied since World War II because of its importance in radar work. Many of the characteristics of optical diffraction can be strikingly demonstrated by the use of microwaves. Microwave diffraction shows certain features, however, that are not in agreement with the Huygens-Fresnel theory, because the approximations made in that theory are no longer valid. Most of these approximations, for example, that made in deriving Eq. (5), depend for their validity on the assumption that the wavelength is small compared to the dimensions of the apparatus. Furthermore, it is not legitimate to postulate that the wave has a constant amplitude across an opening, and zero intensity behind the opaque parts, except for the very minute waves of light.
As an example of the failure of classical diffraction theory when applied to microwaves, the results of the diffraction by a circular hole in a metal screen may be mentioned. The observed patterns begin to show deviations from the Fresnel theory, and even from the more rigorous Kirchhoff theory, when the point of observation is within a few wavelengths' distance from the plane of the aperture. Even in this plane itself there are detection effects that could not have been predicted from the earlier theories, which treat light as a scalar, rather than a vector, wave motion. An exact vector theory of diffraction, developed by A. Sommerfeld, has been applied only in a few simple cases, but the measurements at microwave frequencies agree with it wherever it has been tested. See also: Light; Microwave optics


