Scientists need to measure solar ultraviolet radiation (UV) because increased exposure to UV has been associated with adverse health impacts to humans. These impacts include skin cancer, especially the most virulent form (melanoma), and diseases of the immune system. There are ecological impacts as well, such as potential harm to amphibians and other sensitive organisms, bleaching of coral reefs, and so on. The amount of UV reaching the Earth's surface increases over time if there are no physical interactions or chemical reactions to absorb it as it passes through the atmosphere. In particular, reduction in stratospheric ozone (O3) concentration reduces the amount of UV absorbed in the upper atmosphere, which increases the UV intensity at the Earth's surface.
A number of gases, including those associated with global warming, undergo photochemical reactions that contribute to reductions in stratospheric ozone. The ability to track and document long-term trends in UV intensities across the United States helps researchers assess the effectiveness of international agreements such as the Montreal Protocol (signed in 1987 and amended through 1999), in reducing ozone-depleting substances such as chlorofluorocarbons (CFCs). Thus, reliable UV measurements are needed to help researchers learn how human and ecosystem biological response/sensitivity to UV varies with wavelength, and to track how effective domestic laws and international treaties are at protecting the upper atmosphere from stratospheric O3 reductions.
The National Exposure Research Laboratory (NERL) of the U.S. Environmental Protection Agency (EPA) implemented a research program from 1996 to 2004 to measure UV at 21 unique locations throughout the United States to detect trends due to changes in the amount of stratospheric O3.
Ultraviolet radiation characteristics
Energy reaching the Earth from the Sun facilitates life and also influences weather and climate. UV exists in the portion of the electromagnetic spectrum (in the range 10–400 nanometers) adjacent to the visible wavelengths spanning 400–700 nm.
UV has a higher energy level compared to visible light. It is usually divided into five wavelength ranges based on photon energies and biological effects. The extreme UV band consists of wavelengths between 10 and 120 nm, while the far UV band consists of wavelengths between 120 and 200 nm. The energy in the extreme UV and far UV bands has minimal impact on biological systems. Because biological impacts to living organisms are generally observed at wavelengths beginning at 200 nm, the three UV-wavelength bands that affect biological systems are designated as UV-A, UV-B, and UV-C (see table).
|
Radiation type |
Wavelength, nm |
Photon energy |
UV absorption by O3 (stratospheric ozone) and O2 |
Amount reaching earth |
Surface irradiance |
Biological impact |
|---|---|---|---|---|---|---|
|
UV-C |
200–280 |
High |
High |
Low |
Low |
Low |
|
UV-B |
280–320 |
Moderate |
Moderate |
Moderate |
Moderate |
High |
|
UV-A |
320–400 |
How |
Low |
High |
High |
Moderate |
Impact of UV on human health and the environment
UV can affect human life, animal life, and the environment. Plants exposed to elevated UV-B levels display physiological changes, which indicate evidence of genetic damage and attempted deoxyribonucleic acid (DNA) repair. It has also been implicated in formation of tropospheric (ground-level) O3 caused by the photolysis (light-initiated chemical reaction) of nitrogen dioxide (NO2). UV also plays a role in the formation of photochemical smog [a mixture of NO, NO2, O3, volatile organic compounds (VOCs) and peroxy acetyl nitrate (PAN)]. Other effects associated with UV include ocular damage [such as cataracts, cornea damage (via photokeratitis, an ocular analog to sunburn), and skin damage (accelerated aging, skin cancer)].
UV influences the immunosuppressive response in humans, which may play a role in the development of skin cancer. The human skin chromophore (color component) undergoes photoisomerization (light absorption causing change in molecular structure) as a result of UV. trans-Urocanic acid, or trans-UA (shown below),

UV instrument types
UV is measured by three major types of instruments, narrowband, broadband, and spectral. The performance and capability of these three instrument types varies depending on which portion of the UV spectrum is measured. Some instruments measure UV at discrete wavelengths, whereas others measure UV in narrow or wide wavelength bands.
Broadband instruments
Broadband instruments can be used to measure the biological effect of UV as a function of wavelength. Broadband instruments give a single number representing the integration of irradiant flux over a selected range of UV wavelengths through the use of weighting functions. This is important when assessing the biological response of living organisms to UV. With broadband instruments, the weighting functions are used to calculate numbers that are specific to different biological responses over various UV-wavelength intervals. Most broadband instruments have their spectral response function/spectral sensitivity function (SRF) instrument response set to approximate the erythemal action spectrum (for human skin reddening/sunburn), which occurs within the 280–320-nm range.
An action spectrum is determined by laboratory and field studies for each biological response of interest. Action spectra are specific for each biological effect [for example, sun burn/skin reddening (erythemal action spectrum)], and they specify the shape (relative magnitude) of the biological response to UV exposure. They are not used to assess the absolute magnitude of the response. These spectral response functions and their associated action spectra are used to indicate the relative impact of UV over a specific wavelength range, with respect to specific biological responses.
Broadband devices convert UV into visible (green) light through the fluorescence of magnesium tungstate. The voltage measured by these instruments is a function of the instrument response and the solar irradiance. The instrument response is a function of the solar zenith angle (SZA), the angle between the Sun/Earth line and the local vertical (zenith) position, and the total column ozone (the total amount of ozone in a column of air stretching from the Earth's surface to space).
Broadband instruments are relatively simple to operate and maintain. The measurements provided by broadband instruments are easy to reproduce. Broadband instrument behavior is consistent because the operation of these systems is based on an observable physical property (the fluorescence of magnesium tungstate). These instruments are the least expensive of the three major types to operate. A disadvantage is that they are sensitive to a wide range of wavelengths, which can lead to invalid results. Some earlier broadband instruments lacked temperature stabilization, which caused the operating temperature and instrument calibration temperature to be different. This flaw led to changes in instrument measurement sensitivity and wavelength range shifts.
Narrowband instruments
Narrowband instruments measure UV in a few, discrete wavelength bands. Their operation requires the use of metallic interference filters. These filters allow transmission of UV in wavelength intervals from 5 to 10 nm wide to as small as 2 nm for the latest generation of narrowband instruments. The use of multiple instruments permits simultaneous measurement of UV in different wavelength ranges. This is the type of instrument currently in use by the U.S. Department of Agriculture's (USDA) UV monitoring network.
Narrowband devices, such as radiometers, provide a measurement of light attenuation due to atmospheric aerosols. These instruments are simple and easy to operate. The metallic interference filters have a tendency to degrade over time, but ion deposition techniques can be used to improve filter stability.
Spectral instruments
Spectral instruments that measure UV are called scanning spectroradiometers. These instruments make continuous, spectrally resolved measurements across either the entire electromagnetic spectrum or specific portions of it. Spectral instruments are designed with various configurations, but most contain photomultiplier detectors with single or double monochromators. Most scanning spectroradiometers have double monochromators, which direct incoming solar radiation passing through an initial diffraction grating (with either 1200 or 2400 lines/nm) and through a middle slit that focuses the light onto a second diffraction grating. The multiple grating configuration minimizes stray light from adjacent wavelengths, which is caused by the rapid shift of UV intensity at wavelengths below 320 nm. Multiple diffraction gratings improve the wavelength resolution of scanning spectroradiometers, which can be as low as 0.5 nm.
It usually takes several minutes for scanning spectroradiometers to make one complete scan of the sky. This introduces a measurement anomaly when clouds pass overhead during a scan period. Spectral instruments with photodiode arrays or charge-coupled devices (CCDs) can record the entire spectrum simultaneously. Maintaining long-term calibration of spectral instruments requires great effort. They are more expensive to operate in comparison to broadband or narrowband instruments, because they require highly skilled operators.
Measuring ultraviolet radiation
Scanning spectroradiometers (for example, Brewer spectroradiometers) measure UV irradiance (spectral irradiance) at each wavelength in the instrument's measurement range (286.5–363 nm) during each scan of the instrument. Spectral irradiance is expressed as power density per unit wavelength (for example, milliwatts per square meter per nanometer [mW/m2/nm]).
An average of 30 instrument scans can be obtained during a typical summer day. The relationship between irradiance and wavelength can be graphed, but the graph alone does not give insight into which UV wavelengths/wavelength range(s) cause the most damage to humans and animals. Action spectra are used to indicate injury as a function of UV wavelength.
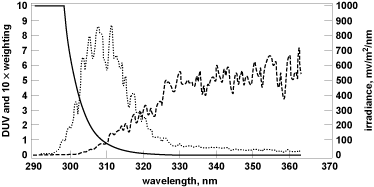
A. F. McKinley and B. L. Diffey developed the erythemal action spectrum to determine which wavelength range was most effective in producing the skin-reddening effect (sunburn) in humans. The erythemal action spectrum is used to measure human skin sensitivity to UV. In Fig. 1, the spectral overlap function (dotted line) is the product of the action spectrum (solid black line) and the spectral irradiance (dashed line). The spectral overlap function displays the portion of the UV spectrum where the biological response to UV is greatest. The spectral overlap function is normalized to one at 300 nm. This function displays the total spectral response (for the biological effect of interest) in the wavelength range where the action spectrum and the spectral irradiance overlap (300–320 nm for erythema [sunburn]).

The area under the spectral overlap function curve (dotted line) yields the biologically effective dose and is expressed in units of joules per square meter (J/m2). To calculate the biologically effective dose (daily dose), you must integrate the area under the spectral overlap function curve with respect to both wavelength (λ) and time as shown in Eq. (1):
If the time duration of UV exposure is known with certainty, the biologically effective dose rate (BED) for a given instant in time can be calculated. This is accomplished by integrating the area under the spectral overlap function curve with respect to wavelength only, as shown in Eq. (2).
EPA's UV measurement data are stored in three types of files. One set of files contains unweighted and weighted (erythemal action spectra) data corresponding to the number of UV scans completed by a monitor during a day. A second set of files contains spectral data in the range 286.5–363 nm (steps of 0.5 nm) with a variable file length, based on the number of monitor UV scans completed in a particular day. The third set of files contains the daily integrated erythemally weighted UV data (DUV).
EPA's UV monitoring network
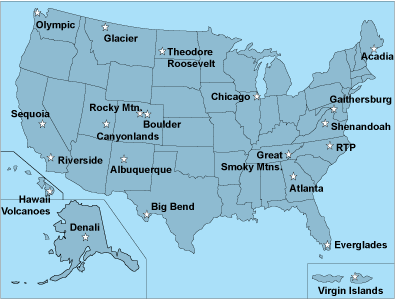
UV monitoring sites (Fig. 2) were located throughout the continental United States, Alaska (Denali National Park), Hawaii (Hawaii Volcanoes National Park), and the U.S. Virgin Islands (Virgin Islands National Park, St. Johns). Fourteen of the sites were located in national parks, and seven sites were located in urban settings.

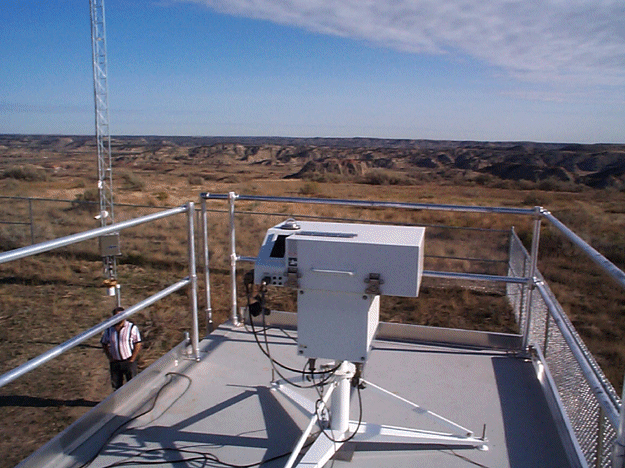
Brewer spectrophotometer UV measurement equipment tracked the Sun and monitored the variation in solar energy throughout the day. UV was measured at wavelengths from 286.5 to 363 nm in 0.5-nm increments. Therefore, each full scan between the minimum and maximum wavelengths produced 154 separate UV intensity measurement values. The data collected at each network site could be used to calculate both the dose and dose rate of UV received at the Earth's surface at various times throughout the day. The UV data collected by the equipment at each site was processed through a quality assurance protocol to ensure proper characterization of the measured UV intensities.
EPA UV monitoring network results
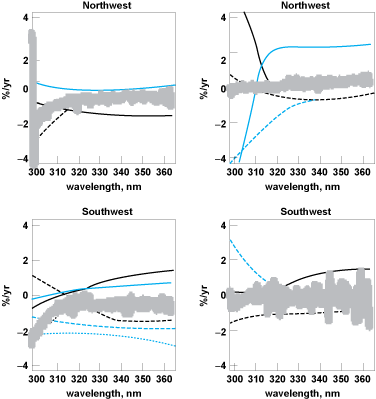
The 21 sites in the EPA's UV network collected an aggregate of 40,474 days worth of UV data during the operational lifetime of the network. More than over 500,000 individual monitor scans were required to collect the data. Approximately 90% of the raw UV data collected successfully passed a rigorous secondary quality analysis consisting of nine separate screening criteria. Instrument measurements indicate that UV varies seasonally as expected, peaking during the summer months and falling to the lowest levels in winter. Analysis of the UV data indicated that the measured daytime UV levels have increased slightly in the Northeast and Southeast United States during the period 1996–2004. The UV measured in the Northwest and Southwest remained relatively constant over the last decade.
Changes in the amount of measured UV over time at each monitor location were analyzed to determine the overall trend (that is, increasing, decreasing, constant). UV measurements were taken at a solar angle of 60° and compiled for all monitor locations. By taking measurements at a constant solar angle, the daily and seasonal variations in UV were reduced along with effects of the sun angle. This allowed a consistent basis for comparison between the sites. Figure 3 shows the trends in measured UV for each region of the United States.

The Northwest sites included Olympic, Glacier, and Theodore Roosevelt National Parks (Fig. 4). The Northeast sites included Chicago, Illinois, Gaithersburg, Maryland, and both Acadia and Shenandoah National Parks. The Southwest sites included Riverside, California, Boulder, Colorado, Albuquerque, New Mexico, along with Sequoia, Rocky Mountain, Canyonlands, and Big Bend National Parks. The Southeast sites included Atlanta, Georgia, Research Triangle Park, North Carolina, and Everglades and Great Smoky Mountain National Parks.

UV data from EPA's UV network can be used by researchers to understand the implications of increased UV linked to decreasing stratospheric ozone concentrations. The UV monitors provided accurate UV measurements of known quality for assessing the impact of domestic and international stratospheric ozone policies. The data allow scientists to evaluate the factors affecting UV in the environment. Our improved understanding of the effect of aerosol loading on UV can be incorporated into climate and atmospheric models. The EPA's quality-assured UV data is posted to a publicly accessible. Website at http://www.epa.gov/uvnet/access.html. The EPA has a 14-volume analysis of its collected UV data along with peer-reviewer comments on that analysis.
The EPA's UV monitoring research program collected, archived, and analyzed a tremendous amount of spectrally resolved UV data. The effect of local factors (such as clouds, haze, etc.) on surface UV at various sites must be adequately determined for various research objectives. EPA's UV measurements were collected in an attempt to answer a myriad of individual questions about UV intensities and their effects on humans, animals, plants, and the environment. Data from EPA's UV network allows characterization of local environment parameters and their effect on surface UV received at any particular site location. Ongoing analysis of the EPA's UV data will continue to provide more clues to how UV trends affect both human and ecosystem exposure.
[Disclaimer: The United States Environmental Protection Agency through its office of Research and Development funded and managed the research described here under the following funding vehicles: contract no. 68-D-04-001 with the University of Georgia at Athens; through Interagency Agreement Number DW13921546-01 with the National Institute for Standards and Technology (NIST); through Interagency Agreement Number DW139392300-01 with the National Oceanic and Atmospheric Administration (NOAA); and through Interagency Agreement no. DW14939466-01-0 with the National Parks Service. It has been subjected to the Agency review and approved for publication. Mention of trade names or commercial products does not constitute endorsement or recommendation for use.]
See also: Aerosol; Air pollution; Albedo; Atmosphere; Atmospheric chemistry; Charge-coupled devices; Deoxyribonucleic acid (dna); Electromagnetic radiation; Environmental engineering; Immunosuppression; Nitrogen oxides; Photodiode; Radiation biology; Radiometry; Solar radiation; Stratospheric ozone; Terrestrial radiation; Ultraviolet radiation; Ultraviolet radiation (biology)


