Key Concepts
The scientific study of climate. Climate is the expected mean and variability of the weather conditions for a particular location, season, and time of day. For planet Earth, the climate is often described in terms of the mean values of meteorological variables such as temperature, precipitation, wind, humidity, and cloud cover. A complete description also includes the variability of these quantities and their extreme values. The climate of a region often has regular seasonal and diurnal variations, with the climate for January being very different from that for July at most locations. Climate also exhibits significant year-to-year variability and longer-term changes on both a regional (Fig. 1) and a global basis. See also: Earth; Global climate change; Meteorology; Weather; Weather forecasting and prediction; Weather observation
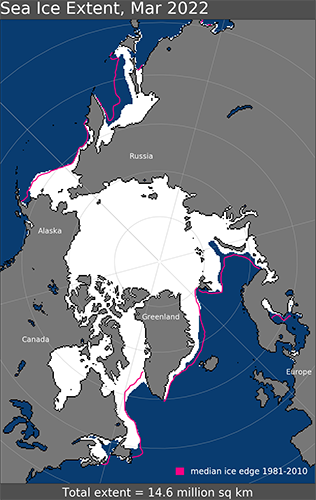
Climate has a central influence on many human needs and activities, such as agriculture, housing, human health, water resources, and energy use. The influence of climate on vegetation and soil type is so strong that the earliest climate classification schemes were often based more on these factors than on the meteorological variables. While technology can be used to mitigate the effects of unfavorable climatic conditions, climate fluctuations that result in significant departures from normal cause serious problems even for modern industrialized societies and more serious problems for the less-developed ones. The goals of climatology are to provide a comprehensive description of the Earth's climate over the range of geographic scales, to understand its features in terms of fundamental physical principles, and to develop models of the Earth's climate for greater understanding and for the prediction of future changes that may result from natural and human causes. See also: Climate modeling; Climatic prediction
Physical basis of climate
The global mean climate and its regional variations can be explained in terms of physical processes. For example, the temperature is warmer near the Equator than near the poles (see table). This is because the source of heat for the Earth is the radiant energy coming from the Sun (insolation), and the Sun's rays fall more directly on the Equator than on the poles. The circulations in the atmosphere and in the oceans transport heat poleward and thereby reduce the Equator-to-pole temperature difference that is continually forced by insolation. The energy released by the rising of warm air in the tropics and the sinking of cold air in high latitudes drives the great wind systems of the atmosphere, such as the trade winds in the tropics and the westerlies of the middle latitudes. See also: Atmospheric general circulation; Equator; Ocean circulation; Tropical meteorology; Wind
|
Station |
Latitude, degrees |
Tannual |
TJan |
TJuly |
Pannual |
PJan |
PJuly |
|---|---|---|---|---|---|---|---|
| Alert | 82.50 N | –18.0 | –32.1 | 3.9 | 156 | 8 | 18 |
| Barrow | 71.30 N | –12.5 | –26.8 | 3.9 | 109 | 5 | 20 |
| Fairbanks | 64.80 N | –3.4 | –23.9 | 15.4 | 287 | 23 | 47 |
| Baker Lake | 64.30 N | –12.3 | –33.6 | 10.7 | 213 | 7 | 36 |
| Anchorage | 61.17 N | 1.8 | –10.9 | 13.9 | 373 | 20 | 47 |
| Juneau | 58.37 N | 4.5 | –3.8 | 12.9 | 1288 | 102 | 114 |
| Edmonton | 53.57 N | 2.8 | –14.7 | 17.5 | 447 | 25 | 83 |
| Seattle | 47.45 N | 10.8 | 3.9 | 18.2 | 980 | 153 | 19 |
| Montreal | 45.50 N | 7.2 | –8.9 | 21.6 | 999 | 80 | 93 |
| Des Moines | 41.53 N | 10.5 | –5.2 | 25.2 | 789 | 32 | 77 |
| Salt Lake City | 40.78 N | 10.7 | –2.1 | 24.7 | 353 | 34 | 15 |
| Washington, D.C. | 38.85 N | 13.9 | 2.7 | 25.7 | 1087 | 82 | 107 |
| San Francisco | 37.62 N | 13.8 | 9.2 | 17.1 | 475 | 102 | t |
| Nashville | 36.12 N | 15.6 | 4.4 | 26.8 | 1146 | 139 | 94 |
| Los Angeles | 33.93 N | 18.0 | 13.2 | 22.8 | 373 | 78 | t |
| Birmingham | 33.57 N | 17.8 | 8.1 | 27.6 | 1349 | 128 | 131 |
| Phoenix | 33.43 N | 21.4 | 10.4 | 32.9 | 184 | 19 | 20 |
| New Orleans | 29.95 N | 20.0 | 12.3 | 27.3 | 1369 | 98 | 171 |
| Havana | 23.17 N | 24.6 | 21.8 | 27.0 | 1126 | 54 | 108 |
| Acapulco | 16.83 N | 27.6 | 26.1 | 28.7 | 1401 | 8 | 230 |
| Caracas | 10.60 N | 26.1 | 24.4 | 26.4 | 545 | 42 | 72 |
| Guayaquil | 02.18 S | 25.5 | 26.5 | 24.2 | 811 | 199 | 0.3 |
| Manaus | 03.13 S | 27.5 | 26.7 | 27.6 | 2294 | 279 | 65 |
| Brazilia | 15.78 S | 20.4 | 21.2 | 18.0 | 1643 | 248 | 6 |
| Rio de Janeiro | 22.90 S | 23.7 | 26.1 | 20.9 | 1218 | 211 | 52 |
| Antofagasta | 23.47 S | 16.2 | 19.8 | 13.2 | 1.9 | 0.0 | 0.3 |
| Santiago | 33.45 S | 14.4 | 21.2 | 8.1 | 264 | 0.1 | 69 |
| Buenos Aires | 34.58 S | 16.9 | 23.7 | 10.6 | 1029 | 104 | 61 |
| Puerto Aisen | 45.50 S | 9.2 | 13.9 | 3.9 | 3001 | 203 | 331 |
| Comodoro Rivadavia | 45.78 S | 12.6 | 18.6 | 6.9 | 216 | 16 | 21 |
| Punta Arenas | 53.00 S | 6.0 | 10.4 | 1.3 | 362 | 40 | 24 |
| Melchior | 64.32 S | –3.6 | 1.0 | –9.3 | 1116 | 42 | 90 |
| Byrd Station | 80.02 S | –27.9 | –14.6 | –35.1 | 39 | 7 | 2.5 |
| Amundsen Scott | 90.00 S | –49.4 | –28.7 | –60.3 | 1.5 | t | t |
*Temperature is in degrees Celsius; °F = (°C × 1.8) + 32. Precipitation is in millimeters; 1 mm = 0.04 in. t indicates trace of precipitation.
The flux of solar energy at the mean distance of the Earth from the Sun is about 1361 watts per square meter (Wm−2). The supply of energy per unit of the Earth's surface area is controlled by geometric and astronomical factors. Because the axis of rotation of the Earth is inclined at an oblique angle to the plane of the Earth's orbit, the declination angle of the Sun undergoes a seasonal variation as the Earth makes its annual circuit around it. The declination angle is equivalent to the latitude at which the Sun is directly overhead at noon. The declination angle varies between 23.5° N at the northern summer solstice (June 21) and 23.5° S at the northern winter solstice (December 22) for the current alignment of the Earth's orbit. The approximate sphericity of the Earth and the annual variation of the declination angle of the Sun cause the incoming solar radiation to be a function of latitude and season. The annual mean insolation is largest at the Equator and decreases toward the poles. The seasonal variation is largest at high latitudes. At the poles, 6 months of daylight alternate with 6 months of darkness. The Earth is closer to the Sun during summer in the Southern Hemisphere, so this region receives about 7% more insolation at this time than the Northern Hemisphere. See also: Insolation
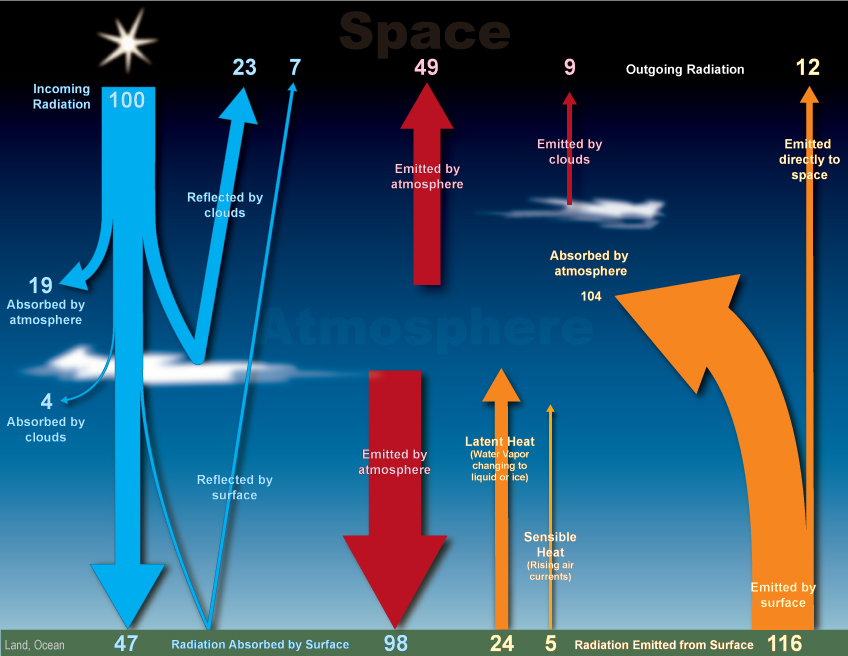
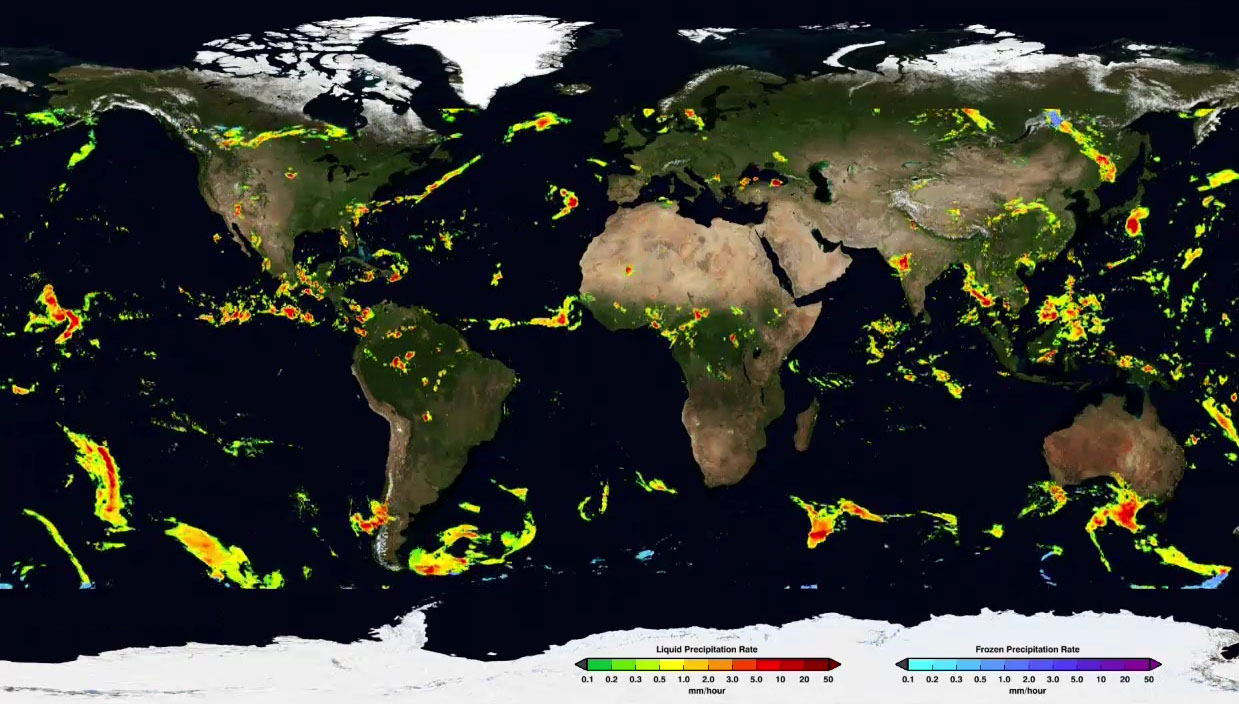
About half of the energy from the Sun that is incident at the top of the atmosphere is transmitted through the atmosphere and absorbed at the Earth's surface (Fig. 2). About 30% is reflected back directly to space, and another 20% is absorbed in the atmosphere. The fraction of the incoming solar radiation that is reflected back to space is called the albedo. The albedo increases when clouds or surface ice and snow are present. It increases toward the poles because the amount of cloud cover and surface ice increases and because the Sun is closer to the horizon, with the result that radiation encounters clouds and the surface at a larger zenith angle. The albedo of desert areas is generally higher than that of heavily vegetated areas or oceans. The solar energy that reaches the surface may be used to raise the surface temperature, or the energy can be used to evaporate water. The energy that is used to evaporate water (latent heat) is later released into the atmosphere when the water vapor condenses to form clouds and returns to the surface in the form of precipitation (Fig. 3). Precipitation does not fall uniformly over the surface of the Earth, but is concentrated in particular locations along the Equator and in the storm tracks at midlatitudes over the oceans east of Asia and America. See also: Albedo; Cloud; Precipitation (meteorology)
Greenhouse effect
In order to achieve an energy balance, the solar energy that is absorbed by the Earth must be balanced by an equal amount of energy that is returned to space. The Earth emits radiative energy at frequencies that are substantially different from those of the Sun because of the Earth's lower temperature. The Earth emits primarily thermal infrared radiation [wavelengths from 4 to 200 micro-meters (μm)], whereas most of the energy from the Sun arrives in the form of visible and near-infrared radiation (0.4–4 μm). The atmosphere is much less transparent to Earth's thermal radiation than it is to solar radiation, because water vapor, clouds, carbon dioxide, and other gases in the atmosphere absorb thermal radiation. Because the atmosphere prevents thermal radiation emitted from the surface from escaping to space, the surface temperature is warmer than it would be in the absence of the atmosphere. The combination of the relative transparency of the atmosphere to solar radiation and the blanketing effect of the gases in the atmosphere that absorb thermal radiation is often referred to as the greenhouse effect. The greenhouse effect on Earth is quite important. See also: Atmosphere; Greenhouse effect
Clouds affect the energy emission of the Earth. The thermal emission is low over tropical regions where high, cold clouds are present, such as the major precipitation regions of equatorial Africa, South America, southern Asia, Indonesia, and the band of clouds along the Equator. Because the albedo is higher, less solar energy is absorbed when clouds are present. Since clouds decrease both the solar energy absorbed and the terrestrial energy emitted to space, the net effect of tropical convective clouds on the energy balance of the Earth is less than their individual effects on solar and terrestrial energy. As a result, the distribution of the net radiative energy exchange at the top of the atmosphere does not clearly reflect the influence of the tall clouds so clearly. In general, the net radiation shows a strong influx of energy at those latitudes where the insolation is strongest. See also: Terrestrial radiation
A striking feature of the distribution of net radiation during July is the low values over the Sahara and Arabian Deserts compared with the surrounding ocean and moist land areas. This is because desert sand has a relatively high albedo, so that less solar radiation is absorbed there. In addition, few clouds and little water vapor are present in the atmosphere over the deserts to absorb the thermal radiation emitted by the very hot surface. Since the emitted thermal radiation is high and the absorbed solar radiation is low, desert areas often show a net loss of radiative energy. This fact plays a central role in the maintenance of desert dryness. The loss of radiative energy is often balanced by convective transport of heat energy into the desert regions by the atmosphere. This results in downward motion of dry air, which flows outward near the ground and prevents the moist surface air of surrounding regions from reaching the desert interior. See also: Desert
Continentality
Annual temperature ranges are much greater near the center of continents in middle and high latitudes than they are over oceans. Land and ocean areas have very different seasonal variations because of their different capacities to store heat. Because the ocean is a fluid, its upper 50–100 m (150–300 ft) is generally in direct thermal communication with the surface. Therefore, solar energy incident on the surface can be absorbed in this large heat reservoir without raising the surface temperature very much. In addition, over the oceans, it is possible for solar energy to evaporate water and thus never be realized as heat at the surface. In contrast, over land, only about the first meter of soil is in thermal contact with the surface, and much less water is available for evaporation. During the winter, the ocean can return heat that was stored during the summer to the surface, keeping the surface relatively warm. However, the land cools off very quickly in winter, warms up rapidly in summer, and experiences large day-night differences. Continental climates in middle latitudes are characterized by hot summers and cold winters, whereas climates that are over or near the oceans are more equable, with milder seasons. See also: Temperature
The distinction between maritime and continental climates can be seen by comparing the annual variations of temperature and precipitation for Tatoosh Island, Washington, with those for Minneapolis, Minnesota (Fig. 4). The temperature at Tatoosh Island varies between a mean of 5.6°C (42°F) for January and a mean of 13.3°C (56°F) for August. This narrow temperature range results from the strong influence of the ocean, which is adjacent to and upwind of the Pacific coast and has a small seasonal variation in temperature because of its large capacity to store and release heat. Although it is at nearly the same latitude, Minneapolis has a much larger annual variation of monthly mean temperatures, with readings of −10.9°C (12°F) for January and 22.4°C (72°F) for July. and show the large annual variation of temperature near the centers of the continents. See also: Maritime meteorology
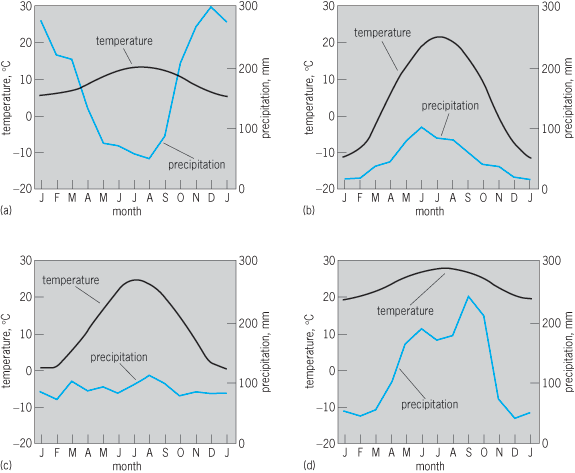
The annual variation of precipitation is also very different in the two climate regimes (Fig. 4). At Tatoosh Island, the precipitation peaks in the winter season, in association with rainfall produced by the cyclones and fronts of wintertime weather. In Minneapolis, the precipitation peaks in the summer season. Most of this precipitation is associated with thunderstorms. Adequate precipitation during the warm summer season is an essential ingredient of the agricultural productivity of the American Midwest.
New York City shows an annual variation of temperature and precipitation that is a combination of maritime and continental. It is near the Atlantic Ocean, but because the prevailing winds are out of the west, it also comes under the influence of air that has been over the continent. It has a fairly large annual variation of temperature, but monthly mean precipitation is almost constant through the year (Fig. 4c). It receives precipitation from both winter storms and summer thunderstorms. Miami, Florida, is in the subtropics at 26°N. The annual variation of insolation is small, so the seasonal variation of temperature is also modest. The precipitation shows a strong seasonal variation, however, with maximum precipitation during the summer half-year, associated primarily with thunderstorm activity. See also: Thunderstorm
General circulation of atmosphere and climate
Many aspects of the Earth's climate are influenced by the nature of the circulation that results from the radiative heating of the tropics and cooling of the polar regions. In the belt between the Equator and 30° latitude, the bulk of the poleward atmospheric energy transport is carried by a large circulation cell, in which air rises in a narrow band near the Equator and sinks at tropical and subtropical latitudes. The upward motion near the Equator is associated with intense rainfall and wet climates, while the downward motion away from the Equator results in the suppression of rainfall and very dry climates (Fig. 3). Most of the world's great deserts, including the Sahara, Australian, Arabian, Kalahari, and Atacama, are in the belts between 10 and 30° latitude.
In middle latitudes, the poleward flow of energy is produced by extratropical cyclones rather than by a mean circulation cell. These storms are thousands of miles wide and are characterized by poleward motion of warm, moist air and equatorward motion of cold, dry air. Most of the wintertime precipitation in middle latitudes is associated with weather disturbances of this type.
Surface features are also of importance in determining local climate. Mountain ranges can block the flow of moist air from the oceans, resulting in very low rainfall beyond the mountain ranges. The dryness of the Great Basin of North America and the Gobi Desert of Asia is maintained in this way. On the upwind side of mountain ranges, forced ascent of moist air can result in very moist climates; this occurs, for example, on the west slope of the coastal mountains of western America and the south slope of the Himalayas during the summer monsoon. The downwind sides of such mountains are often very dry, since the moisture precipitates out on the upwind side. Two locations that show the effect of topography on local climates are Puerto Aisén, Chile, and Comodoro Rivadavia, Argentina, which are both located near a latitude of 45°S (see table). Puerto Aisén is on the westward and upwind side of the Andes Mountains in a deep valley that is exposed to the midlatitude westerly winds coming off the Pacific Ocean. It receives more than 3 m (10 ft) of precipitated water annually. Only a few hundred miles downwind of the Andes on the Atlantic seaboard, Comodoro Rivadavia receives only about 0.2 m (8 in.) of precipitation each year. See also: Wind
Complete climate system
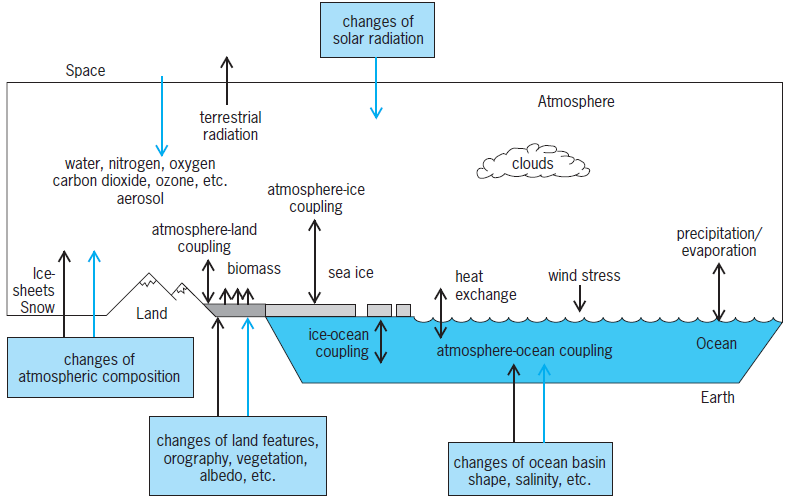
The Earth's climate results from complex interactions among externally applied parameters, including the distribution of insolation, and internal interactions among the atmosphere, the oceans, the ice, and the land (Fig. 5). The composition of the atmosphere, which plays a key role in determining the surface temperature through the greenhouse effect, has been radically changed by the life forms that have developed, and continues to be modified and maintained by them. The atmosphere and the oceans exchange heat, momentum, water, and important constituent gases, such as oxygen and carbon dioxide. The exchange of constituent gases is strongly influenced by life in the ocean. The hydrologic cycle of evaporation, cloud formation, and precipitation as rain or snow is intimately connected to the climate through the effects of water vapor, clouds, and surface ice on the radiation balance of the planet. Vegetation interacts strongly with the hydrologic cycle over land to determine the soil moisture, surface albedo, evaporation, precipitation, and surface water runoff. See also: Hydrology
Evolution of Earth's climate
The climate of the Earth is unique among those of the planets in the solar system. All the planets evolved out of material in the rotating cloud from which the solar system was formed. The subsequent evolution of the planets' atmospheres depended critically on the mass of each planet and its distance from the Sun.
The mass of the Earth and its distance from the Sun are such that water can exist in liquid form rather than being frozen or escaping to space. The liquid water formed the oceans and led to the development of photosynthetic life, which reduced the carbon dioxide content and increased the molecular oxygen content of the atmosphere. Planets that are closer to the Sun receive more solar energy per unit area and are thus much hotter than the Earth. The surface of Venus is sufficiently hot that water vapor cannot condense. Venus has a very thick atmosphere composed mostly of carbon dioxide. On Mars, which is farther from the Sun than the Earth is, and therefore colder, water freezes, leaving a very thin atmosphere of carbon dioxide. Thus the basic climatic conditions of a relatively circular orbit at a favorable distance from the Sun led to a drastically different evolutionary history for the Earth than for the neighboring planets. See also: Evolution of the atmosphere; Solar system
History of Earth's climate
Direct measurements allow the estimation of the global mean surface temperature of the Earth for only about the past 140 years. Global surface air temperature rose by about 0.3°C (0.5°F) between 1880 and 1940 and then declined slightly in the following three decades. In January 2022, the global temperature was 0.89°C (1.6°F) above the twentieth century average of 12.0°C (53.6°F).
Evidence of climate variations in prehistoric times must be obtained from proxy indicators in dated sediments, such as pollen spores, the shells of small animals, or isotopic abundances, or from geological features such as the terminal moraines of glaciers or dry lake beds. A wealth of geological evidence exists to indicate that the Earth underwent a great glaciation as recently as 20,000 years ago. During this period, ice sheets nearly 3 km (2 mi) thick covered parts of North America and Western Europe. Variations in the relative abundance of oxygen isotopes in deep-sea cores indicate that there has been a succession of periods of major glaciations separated by relatively warm, ice-free periods called interglacials during the last million years of Earth history (Fig. 6). See also: Paleoclimatology
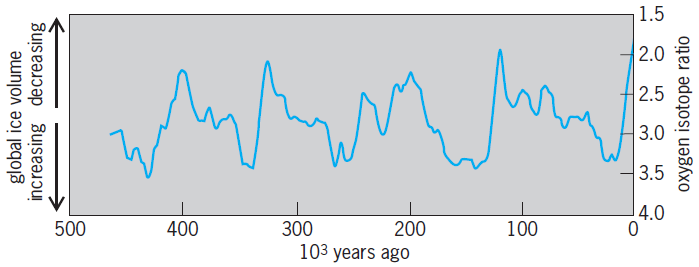
Analyses of time series show a relationship between global ice volume and known variations in the Earth's orbit. The parameters of the Earth's orbit include the eccentricity, which measures the departure from a circular orbit to a more elliptical one; the obliquity, which measures the tilt of the axis and therefore the magnitude of the annual variation in the declination angle of the Sun; and the longitude of perihelion, which measures the season at which the Earth makes its closest approach to the Sun. These parameters control the seasonal and latitudinal distribution of insolation. Because ice sheets form primarily on land and much of the land area is in northern latitudes, ice sheets form more readily when the summertime insolation is relatively low, allowing some of the winter snow accumulation to survive the summer season. The global climate responds to the presence of the ice sheets through a process called ice-albedo feedback. Ice sheets are more reflective of solar radiation than other surfaces, so that their presence tends to reduce the amount of solar heat absorbed by the Earth. This, in turn, leads to a cooling of the planet and a greater tendency for the ice sheets to grow. See also: Earth rotation and orbital motion
Evidence from air bubbles trapped in glacial ice indicates that atmospheric concentrations of greenhouse gases such as carbon dioxide and methane were lower during past glacial ages than they are at present. The concentration of carbon dioxide 20,000 years ago, during the last glacial age, was only about 190 parts per million by volume (ppmv), compared with the preindustrial level of 280 ppmv and the current concentrations are over 400 ppmv. The rather low values of carbon dioxide during past glacial periods are thought to have been produced by changes in ocean chemistry and biology. Such low greenhouse gas concentrations contribute significantly to the cooling associated with glacial advances.
Future climate changes
Past relationships between the Earth's orbital parameters and global ice volume indicate that the Earth will undergo another major glacial age within about 25,000 years from now. Currently, however, the composition of the Earth's atmosphere is changing rapidly as a result of human influences. Of climatic interest are industrial gases that are transparent to solar radiation entering the Earth's atmosphere but are opaque to the thermal radiation emitted by the Earth. Gases with these characteristics are called greenhouse gases. In order to achieve an energy balance in the presence of an increased concentration of greenhouse gases, the Earth's surface must warm, so that its thermal emission will increase to offset the increasing downward emission of thermal energy from an atmosphere that is becoming more effective at intercepting outgoing thermal radiation, if other factors remain the same. The principal greenhouse gases are carbon dioxide, which is increasing principally because of the burning of coal and oil; methane or natural gas, whose increase is related to agriculture and coal and gas mining; nitrous oxide, which is a product of the decay of fixed nitrogen in plants or artificial fertilizer; and chlorofluorocarbons, which are gases used in industry for refrigeration, foam blowing, and cleaning, and as aerosol propellants. Carbon dioxide is expected to contribute most of the increase in atmospheric thermal opacity through the end of the twenty-first century. See also: Carbon dioxide
Within the next 100 years, if current trends continue, climate models indicate that human activities will result in a climate that is 2–4°C (3.6–7.2°F) warmer than it is today. The magnitude of this increase is similar to that between the present climate and the last glacial age and would represent an extremely rapid warming by the standards of natural climate variability and change. Studies also suggest an increased probability of drought during the summer growing season in midlatitude agricultural areas and rising sea levels, which may be as much as 1 m (3.3 ft) higher than present levels by the year 2100. See also: Climate history; Climate modification; Drought; Mesometeorology; Micrometeorology


