The notion that thermal convection currents must exist in the Earth's mantle occupies a central position in theories which have been proposed to account for the occurrence of continental drift and sea-floor spreading. Apart from the controlling influence which these currents exert on surface geological processes such as mountain building, they also govern the rate at which heat is transferred from the hot interior of the Earth to its surface and so are crucial to understanding the thermal history of the planet. Mantle convection serves as the guiding principle in the geological and geophysical sciences. See also: Evolution of the continents
Seafloor spreading and continental drift
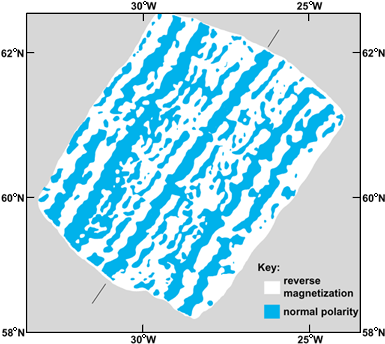
Although even the earliest geographers were impressed by the apparent fit of the coastlines of South America and Africa, it was not until the methods of paleomagnetism had been developed that a plausible case could be made that these two continents had once been joined together as part of the supercontinent Pangea over 100 million years ago. The most important advance in understanding the agency through which breakup of this supercontinent occurred was made in the early 1960s in studies of the pattern of magnetic anomalies observed over a mid-oceanic ridge. The characteristic pattern of magnetic stripes (Fig. 1) could be understood in terms of the sea-floor spreading hypothesis, which had been advanced a few years previously. It was suggested that hot material rising from the Earth's mantle beneath the ridge crest acquired an induced magnetization as it was cooled below the Curie point in the Earth's local magnetic field. The material was normally or reversely magnetized, depending upon the polarity of the field at the time of cooling. Although the reason for the episodic reversal of the polarity of the field is not understood in detail, the fact that such reversal occurs allows the sea floor, as it spreads horizontally from a mid-oceanic ridge, to produce a magnetic tape recording of its own large-scale horizontal motion. When the spatial pattern of reversals which is recorded on the sea floor in this way is combined with the time scale for the same reversals established on land, using radiometric dating methods, the pattern of magnetic stripes can be used to measure the horizontal spreading rate as a function of location. When this is done for the globe-encircling pattern of oceanic ridges, local spreading rates are obtained that vary from 0.4 to 4 in. (1 to 10 cm) per year. See also: Dating methods; Mid-Oceanic Ridge; Paleomagnetism; Rock age determination; Rock magnetism
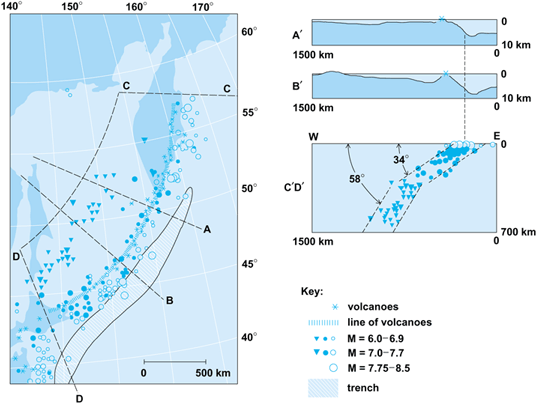
Paleomagnetic methods have therefore been instrumental in establishing that hot mantle-derived material is continuously rising under and spreading horizontally from the mid-oceanic ridges. That cold and relatively old material is elsewhere descending into the mantle has been demonstrated in an equally convincing fashion by using the methods of seismology. Prior to the advance of the spreading hypothesis, it was suggested that the deep ocean trenches were regions where ocean floor was being downthrust into the mantle along Benioff zones (Fig. 2). These zones are defined by the internal locus of deep seismicity. This process is referred to as the subduction of oceanic lithosphere. Taken together with the evidence of spreading, the occurrence of subduction constitutes strong evidence for the existence of a thermally induced circulation in the Earth's mantle. Such a circulation is by definition one which is maintained against dissipative frictional processes by the continuous conversion of potential into kinetic energy through the action of the buoyancy force. This conversion is effected whenever hot material rises (spreading) and cold material sinks (subduction). The store of potential energy upon which the circulation continuously draws is found in the large increase of temperature between the Earth's surface and the core-mantle boundary. See also: Lithosphere; Subduction zones
Among the other lines of evidence which have combined to strongly reinforce this model, perhaps the most important concerns the characteristic variations of heat flow and bathymetry across the ocean floor as a function of ocean-floor age. From the many thousand heat flow measurements which have been made in boreholes on the ocean bottom, it is clear that heat flow varies inversely as the square root of the age of the seafloor. Near the mid-oceanic ridges, the heat flow achieves a maximum value which is in excess of 400 mW · m−2, while the flow of heat through the oldest seafloor (age less than 150 × 106 years) is between 40 and 45 mW · m−2. These numbers should be compared with the mean heat flow through the continents of about 60 mW · m−2. Ocean-floor depth (bathymetry) varies in a similarly systematic fashion. The shallowest depths are found above the mid-oceanic ridges, and depth increases with the square root of the age of the ocean floor, reaching values in excess of approximately 2 mi (3 km) in the oldest oceans (Fig. 3). These characteristic variations are precisely the variations to be expected if the ocean floor constitutes an intrinsic part of the cold surface boundary layer of a mantle-wide convective circulation and if this circulation is forced to an important extent by heating from below due to the action of a substantial heat flux across the core-mantle boundary. See also: Continental drift; Earth's heat flow
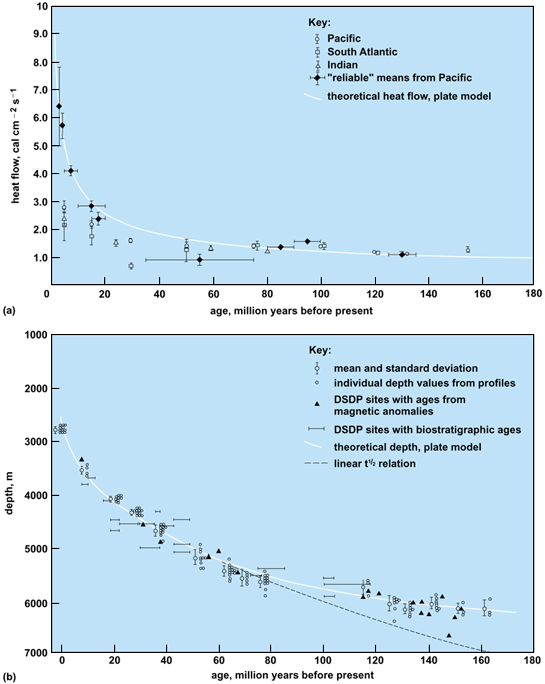
Plate tectonics
From a global perspective, attempts to describe the surface manifestations of the underlying mantle convective circulation have given rise to a body of descriptive ideas which have collectively been called plate tectonics. In this kinematic picture, the surface of the Earth is seen to be divided into a relatively small number of rigid plates which interact with each other only at their boundaries. Continents are carried passively by the plates and drift with them over the Earth's surface. The boundaries separating adjacent plates are defined on the basis of the global distribution of seismicity, in terms of which it was first recognized that the system of mid-oceanic ridges, deep ocean trenches, and their important interconnections via transform faults was continuous. See also: Marine geology; Transform fault
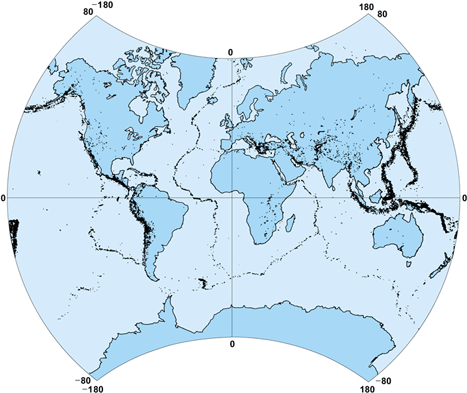
Volcanic activity is confined to regions of active subduction along plate margins (Figs. 4 and 5). Most major mountain systems are also found in the same regions (the Himalayas, Andes, Alps, and North American Rockies). The idea of plate tectonics is to describe surface geological processes such as mountain building and volcanism as consequences of the interactions among this relatively small number (12) of plates. For example, the currently growing Himalaya Mountains are a product of the collision between the Indian and Eurasian plates. Most volcanic activity is also sharply confined to plate boundaries. The molten rock involved in a volcanic eruption at a mid-ocean ridge is produced by pressure-induced melting when hot material rising in the ascending limb of a convection cell crosses the melting curve as it decompresses. In such locations the lavas are predominantly basaltic. Andesitic volcanoes, on the other hand, are found in the island arcs associated with subduction zones, and their lavas are distinctly different in composition from those found on mid-oceanic ridges. Not all volcanic activity is confined to the plate boundaries. For example, intraplate volcanism, such as that associated with the Hawaiian Islands, also exists, and the explanation of this phenomenon remains somewhat enigmatic. One suggestion is that such features are produced by thermal plumes of small horizontal scale, which are formed episodically in the hot lower thermal boundary layer of the circulation in consequence of the temperature dependence of mantle viscosity, and which can rise quickly and adiabatically to the base of the lithosphere, where they induce intense partial melting.
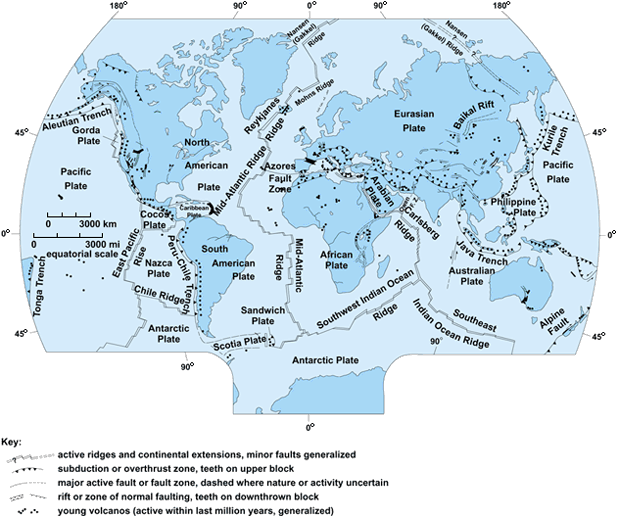
The detailed relation between the surface plates and the convective circulation in the underlying mantle of the Earth is a subject of scientific investigation about which there is no consensus. Most evidence, however, suggests that there is an approximately 1:1 relation between surface plates and deep mantle convection cells, although the three-dimensional geometry of this large-scale flow is expected to be complex. It is perhaps surprising therefore that simple physical models based upon understanding of thermal convection in liquids can provide a general outline of understanding of complex geological processes. See also: Plate tectonics
Dynamic models of mantle convection
The ability of the mantle convection hypothesis to reconcile the surface observations can be seen most clearly through an understanding of the meaning of the nondimensional parameter called the Rayleigh number, Ra, which determines the strength of the convective circulation which will be caused by a given thermal forcing across a layer of viscous fluid of depth d. This number is defined as shown in Eq. (1),
where g is gravitational acceleration acting through the layer, α is the coefficient of thermal expansion, κ is the coefficient of thermal diffusivity, |b is the temperature gradient at the base of the layer, Q is the rate of internal heating per unit volume (due to radioactive decay processes, for example) divided by the product of density and specific heat capacity, and ν is the kinematic viscosity. Theoretical analysis shows, and laboratory observation confirms, that unless Ra exceeds a critical value Rc, which is normally of order 103, thermal convection is impossible.
An estimate of Ra for the whole mantle of the Earth can be made by employing the experimentally determined parameters: g ≈ 4 × 102 in. · s−2 (103 cm · s−2), α ≈ 1.4 × 10⁻⁵ K−1, κ ≈ 3.875 × 10⁻³ in.2 · s−1 (2.5 × 10⁻² cm2 · s−1), and d ≈ 1.7 × 10³ mi (2.9 × 10³ km) as the mantle depth. The kinematic viscosity ν may be inferred through analysis of postglacial rebound data, which requires a value of ν between 4.65 × 10²¹ and about 1.55 × 1022 in.2 · s−1 (3 × 10²² and about 1023 cm2 · s−1), with an increase from the low value to the high value across the seismic discontinuity at 402 mi (670 km) depth. Also obtained from the glacial rebound data is a measurement of the thickness t ≈ 60 mi (100 km) of the layer near the surface, called the lithosphere, in which the effective viscosity is extremely high. The remaining parameters in Eq. (1), |b and Q, are the least well determined, but can be estimated separately on the basis of alternate limiting assumptions. If Q ≈ 0 in the mantle, an estimate can be made of |b ≈ , where Tb is the temperature at the core mantle boundary and Ts is the surface temperature. Since the outer core is mostly iron, and since it is in a liquid state, a minimum estimate of the temperature Tb may be obtained from the melting point of iron at core-mantle boundary pressures, and estimates are in the neighborhood of 7200°F (4000°C). This could be reduced substantially owing to the presence of a light alloying element, and such a component must exist in the outer core in order to explain the seismically observed mean atomic weight of the material in this region. Using Tb ≈ 3000°C in Eq. (1) and Q = 0, Ra ≈ 107 is obtained. This value is four orders of magnitude larger than the normal critical value of 103, so that the mantle is convectively unstable and thermally driven circulations must exist.
The Rayleigh number may also be estimated on the basis of the alternate assumption |b = 0, and a lower bound on Q may be deduced by assuming that the heat which leaves the Earth's surface is in equilibrium with the rate at which heat is generated internally by radioactive decay processes. This gives ρm cp Q = , where qs is the mean surface heat flow of about 80 m W · m−2, and ρm and cp are the mean mantle density and specific heat capacity, respectively. Substituting this value of Q into Eq. (1) yields a value of Ra which is also enormously in excess of the critical value. No matter how the Rayleigh number is estimated, the conclusion that thermal convection currents are expected in the Earth's mantle is inescapable.
The question as to how these convection currents are driven, whether predominantly by heating from below through |b or by internal heating through Q, is not well understood. Also, no consensus exists concerning the depth to which the circulation extends. The heated-from-below model is preferred from several points of view, however, and it will be employed here to demonstrate the ability of the convection hypothesis to reconcile the surface observations described previously. By using boundary layer theory for thermal convection at high Rayleigh number, simple expressions are obtained for the characteristic horizontal velocity of the circulation , the thermal boundary layer thickness δ, and the surface heat flux qs, as shown in Eqs. (2),
where the ai(Δ) are functions of the aspect ratio of convection Δ, which is the ratio of the horizontal scale w of a convection cell to its vertical scale d. In laboratory convection, the realized aspect ratio is ≈ 1, and if this is assumed for the mantle circulation with d equal to the mantle thickness, horizontal scales of several thousand kilometers are implied, and in fact, such is the value of the mean horizontal scale of the observed surface plates. If the value Ra ≈ 107 is used in Eqs. (2) and Δ = 1, then ≈ 2.8 in. (7 cm) per year, δ ≈ 60 mi (100 km), and qs ≈ 100 mW · m−2. These are very close indeed to the observed surface plate speed, the observed thickness of the lithosphere, and the observed mean surface heat flow. The most important assumption in this simple picture of the convection circulation in the mantle is that the oceanic lithosphere is an intrinsic part of the cold thermal boundary layer of the flow responsible for plate creation and destruction. When this assumption is coupled with the notion that convection fills the entire mantle, the observed mean properties of the circulation are related as they would be in a laboratory convection apparatus. See also: Convection (heat)
Mantle convection with phase transitions
In order to develop a more detailed understanding of the mantle convention process, beyond that embodied in the simple scaling relations discussed above, it is necessary to construct explicit hydrodynamic models. Most such models are based upon the conventional conservation laws for mass, momentum, and internal energy and the equation of state for a viscous fluid. The equation of state considers the incremental variations of density that exist in the mantle in consequence of any transitions of phase that may be induced by the hydrostatic compression of its constituent material. In fact, the existence of such phase transformations is well established. The most important of these from the perspective of the dynamics of the mantle convection process are the exothermic transition from olivine to the α-spinel structure that occurs near a depth of 240 mi (400 km) and the endothermic transition from β-spinel to a mixture of perovskite and magnesiowüstite that occurs near 400 mi (660 km) depth.
A series of contour maps showing the temperature field in the mantle can be developed from a modern hydrodynamic model of the mantle convection process. The individual images show the mantle in half-section (spanning a time period of about 600 million years) because the numerical model is based upon the assumption that the flow, although occurring in a three-dimensional spherical shell, may be treated as though it were independent of the longitudinal coordinate. The sequence of images demonstrates that the influence of the phase transitions, especially the endothermic transition at 400 mi (660 km) depth, on the convection process is profound. Expressed in the simplest way, the impact of this transition is such as to quite strongly inhibit the flow of mass across this horizon. The degree of inhibition is in fact so strong that the flow spends extensive periods of time in a state in which the circulation is almost perfectly layered. This state is disrupted by episodic instabilities of the thermal boundary layer that develops across the 660-km endothermic horizon when the flow is in the layered state. These disruptions take the form of intense “avalanches” of cold material from the upper mantle into the lower mantle, during which the vigor of the convective circulation increases significantly. In the axi-symmetric model, these episodes of “whole mantle” convection appear to last for times of order 100–200 million years, while the intervening periods of layered convection last two to three times longer.
If such processes occur in the real Earth, they could be involved in a variety of different and heretofore unexplained phenomena. Principal among these is the so-called supercontinent cycle of ocean basin opening and closing. This cycle and the cycle of orogeny (mountain building) that accompanies it is well expressed in the histogram of occurrence of surface continental rocks as a function of their age. When an avalanche occurs across the 660-km transition, the intense downwelling that occurs at this location causes even extremely distant material on the Earth's surface to collect in the basin above it. This is a plausible mechanism whereby continental fragments may be collected together to form a supercontinent.
Seismic-tomography-based models
In attempting to verify the predictions of the a priori models of mantle convection, discussed above, images of the three-dimensional internal structure of the mantle density field derived on the basis of the application of seismic tomography are important. These methods, which are very similar to the CAT scan techniques employed in medicine, are able to deliver models of the internal variation of a seismic body wave speed, typically that for shear waves. On the basis of the assumption that variations in shear-wave speed may be attributed to variations of temperature alone, the three-dimensional images of shear-wave speed may be mapped directly into variations of temperature. See also: Computerized tomography
Mathematical expressions developed from a model based on seismic tomographic imaging may be solved to predict a variety of observable characteristics of the mantle convective circulation. The most important characteristics undoubtedly include the planet's gravitational field, the velocities of the surface plates, the topography on the core-mantle boundary, the dynamic component of the topography on the Earth's surface, and the advected component of the radial heat flow. Two such comparisons can be illustrated—the first for the nonhydrostatic geoid and the second for the dynamic topography of the Earth's outer solid surface. Since the existing models of seismic tomography provide information only on the longest horizontal wavelength constituents in the internal density field, and are similarly constrained in their ability to resolve radial structure, the theory can be tested only on these largest scales.


