All of the Earth beneath the land surface and the ocean bottom, including the crust, the mantle, and the core. The interior is not accessible to direct observation. Nevertheless, a rather detailed model has been constructed on the basis of measurements made at or above the surface. Measurements of gravity, the geomagnetic field, surface heat flow, and surface deformation can all be used to put constraints on the Earth model, but the most detailed information about the interior is provided by seismic measurements. To the nonspecialist, seismic methods are perhaps best known for their application to the oil exploration industry, where seismic data are used to map the subsurface structure of sedimentary basins. In the exploration of the Earth's interior, the seismic waves being analyzed are usually generated by earthquakes, and measurements are made of waves propagating through the interior of the body (body waves), waves propagating along the surface (surface waves), and standing waves bringing the whole Earth into a state of oscillation (free oscillations). Such measurements, when properly interpreted, provide information about seismic-wave velocities in the Earth. On the other hand, seismic-wave velocities can also be measured in laboratory experiments where rock samples are subjected to the high pressures and temperatures typical of conditions in the deep interior. Meteorites provide rock samples of materials that are probably abundant in the solar system. The comparison of laboratory and field measurements thus leads, by inference, to a model where the composition and temperature distribution can be specified to some extent. What emerges from these studies is a picture not only of the structure but also of the evolution and dynamics of the Earth's interior.
Earth among the planets
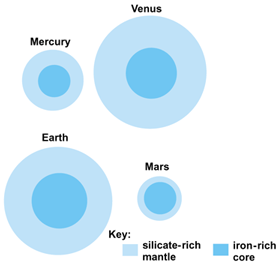
The Earth is a planet with a mean radius of 3959 mi (6371 km). The principal departure of the Earth from a spherical shape is an equatorial bulge caused by the centrifugal effect of the Earth's rotation. The geometrical flattening, which is defined by the ratio , where a and c are the equatorial and polar radius, respectively, is estimated to be about 1 part in 298. Internal layers similarly exhibit a flattening, which gradually decreases toward the center of the Earth. The mean density of the Earth is 3.189 oz/in.3 (5.517 g/cm3), and the moment of inertia is 0.527 times that of a body of constant density with the same size and mass as the Earth. The fact that this factor for the Earth is much smaller than unity is one of the clearest indications that the Earth has a central core of greater density than the surrounding mantle. A plausible assumption consistent with the composition of meteorites is that of a stony mantle composed mainly of minerals rich in silicate and magnesium and a core composed mainly of iron. The Earth is probably not unique in that respect. It is generally assumed that the planets and meteorites formed at the same time about 4.5 billion years ago, shortly after the origin of the Sun. From the matter that was then available, most of the lighter gaseous material was amassed by the large outermost planets, while the four smaller innermost earthlike planets and the meteorites consist mainly of heavier rocky material. The mass and moment of inertia of the earthlike planets are all consistent with the model of an iron-rich core surrounded by a more silicate-rich mantle, although the relative proportions may be different for different planets, as shown in Fig. 1. Venus is the planet resembling Earth most closely in size and mass, yet there are observable differences in behavior of the two planets. Of interest for comparison with the Earth's interior is the virtual absence of a magnetic field produced by Venus. See also: Solar system
Earth model concept
One significant aspect of the evolution of the Earth is the differentiation of relatively heavy and light material, as evidenced in a crude way by the moment of inertia. It is then not unreasonable to envisage an idealized concept of the Earth that is spherically stratified, with the heavier material in the innermost shells. Of course, the Earth is not spherically symmetric, and this is most obvious at the surface, but a spherically symmetric model does serve the purpose of identifying the essentially layered structure of the Earth, and it serves as a reference against which to measure lateral variations of structure. Evidence for this layered structure has come first of all from seismic studies. Thus several standard Earth models have been constructed in the past. One of the more comprehensive models was constructed in 1981 by A. Dziewonski and D. Anderson, the Preliminary Reference Earth Model (PREM). The principal regions of this model are listed in Table 1. See also: Earth
| Layer | Approximate depth range,* mi (km) |
|---|---|
| (1) Ocean layer | 0–1.8 (0–3) |
| (2) Upper and lower crust | 1.8–15 (3–24) |
| (3) Lithosphere below the crust | 15–50 (24–80) |
| (4) Asthenosphere (low-velocity zone) | 50–140 (80–220) |
| (5) Upper mantle above phase or compositional changes near 240 mi (400 km) | 140–240 (220–400) |
| (6) Transition region between phase or compositional changes near 240 and 416 mi (400 and 670 km) | 240–416 (400–670) |
| (7) Lower mantle above core-mantle boundary layer | 416–1703 (670–2741) |
| (8) Core-mantle boundary layer (D”) | 1703–1796 (2741–2891) |
| (9) Outer core | 1796–3200 (2891–5150) |
| (10) Inner core | 3200–3959 (5150–6371) |
*Depth ranges are uncertain, especially in the crust and upper mantle.
Seismic structure
The seismic structure of the Earth is studied by analyzing body waves, surface waves and free oscillations, and anisotropy.
Body waves
These are generated by earthquakes or large (nuclear) explosions and are recorded by many seismic stations throughout the world. There are about 2000 stations, but any particular wave is usually recorded at only a limited subset of these. Body waves are characterized as P (primary) and S (secondary) waves. Both wave types are supported by a solid, but P waves have a higher velocity and arrive first. It is routine practice that the stations report the arrival time of the first P wave to an earthquake information center, where these data are used to locate the earthquake and determine its origin time. By subtracting the origin time from the arrival times, the travel times of waves from the earthquake to the stations are determined, and these travel times can be used to determine the seismic velocity structure of the Earth's interior. Methods to determine the three-dimensional velocity structure are collectively known as tomography, a term derived from similar applications of travel time inversion used in medicine. However, the original purpose in seismology was to determine the velocity structure of a spherically stratified Earth model. The pioneering work of H. Jeffreys and K. Bullen in 1932–1942 resulted in travel time tables for many types of P and S waves, and formed the basis for the construction of P and S velocity models of the Earth. See also: Earthquake; Seismology
Surface waves and free oscillations
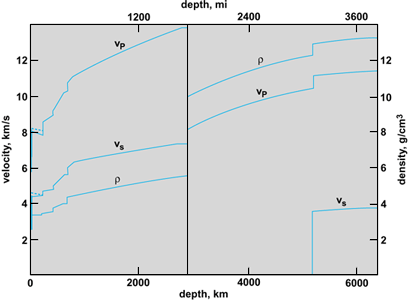
These are also generated by earthquakes. The velocity with which surface waves propagate is a function of the frequency of the waves, that is, the surface waves are dispersive. The dispersion depends on the seismic velocity structure of the surface layers. The free oscillations of the Earth resonate only at certain discrete frequencies (the eigenfrequencies), that is, the free oscillation spectrum would be a line spectrum (in practice the lines are somewhat smeared because of dissipation of the oscillations). The eigenfrequencies depend on the velocity structure of the whole Earth. Thus surface waves and free oscillations provide an alternative data set for constructing velocity models. After the big Chilean earthquake of 1960 provided the first observational evidence of free oscillations of the Earth, methods for inverting eigenfrequencies were developed. However, when seismic velocity models based on free oscillations became available, it was discovered that they were somewhat slower than velocity models based on body-wave travel times. It was initially thought that the travel time model was biased, since nearly all stations are located on continents. However, the effect was not sufficient to explain the difference, and the question was first resolved when the effect of anelastic damping of the waves was taken into account. PREM is based on both travel times and free-oscillation data. The model for a wave period of 1 s is shown in Fig. 2. See also: Oscillation
The quality factor (Q) is used to quantify the damping of wave motion. The reciprocal of the quality factor (Q−1) is defined as the fraction of elastic energy dissipated, per wavelength for traveling waves like body waves or surface waves, and per period for standing waves like free oscillations. Two consequences of the dissipation are a slight shift of the eigenfrequencies of standing waves and a slight change of the velocity of traveling waves. The changes depend on the period of the waves. In particular, a velocity model based on free oscillations with periods about 200 s is expected to be slower than a model based on body waves with periods about 1 s, which is precisely what the results show.
The quantity Q is also an important indicator of the physical state of the interior. The intrinsic Q at any point equals the Q of a body wave passing through. There is in fact a different Q for P and S waves; usually S waves dissipate faster than P waves, hence Qs < Qp. Q is a function of frequency such that dissipation effectively takes place within a certain frequency band, called the absorption band. The position of this band depends on temperature, pressure, and other special conditions. Table 2 gives a rough estimate of Q for P waves at a 1-s period in different regions of the Earth. Q is strikingly low in the asthenosphere and near the top of the inner core. These are also solid regions of the Earth believed to be near the melting point. Viscosity similarly decreases with increasing temperature, and a connection between Q and viscosity has been contemplated. See also: Asthenosphere; Viscosity; Wave motion
| Region | Depth range, mi (km) | Qp |
|---|---|---|
| Lithosphere | 0–50 (3–80) | 1500 |
| Asthenosphere | 50–140 (80–220) | 200 |
| Upper mantle | 140–240 (220–670) | 400 |
| Lower mantle | 416–1796 (670–2891) | 1000 |
| Outer core | 1796–3200 (2891–5150) | 10,000 |
| Top of inner core | 3200–3262 (5150–5250) | 200 |
| 3262–3387 (5250–5450) | 300 | |
| 3387– 3511 (5450–5650) | 600 | |
| Central inner core | 3511–3959 (5650–6371) | 1000 |
Anisotropy
This refers to the directional dependence of the wave velocity. Anisotropy in the Earth's interior may be induced by flow of material containing noncubic crystals or elongated grains. Anisotropy has been observed in the lithosphere, especially under the oceans, and has been postulated for the asthenosphere. This anisotropy has been explained in terms of alignment of olivine crystals, which are thought to be the dominant material in these layers. In PREM the asthenosphere and lithosphere below the crust are anisotropic, although for practical reasons the anisotropy is of the simplest possible type such that there is no directional dependence within the horizontal plane; this is known as uniaxial anisotropy or transverse isotropy. The anisotropic regions of PREM (Fig. 2) are characterized by velocities in both the vertical and the horizontal directions. Anisotropy may occur in deeper regions of the Earth as well, but is difficult to resolve. However, to account for the differences in travel time between P waves passing through the inner core in the equatorial and polar directions, respectively, it has been proposed that the inner core is anisotropic, although the physical mechanism is not understood. See also: Lithosphere; Olivine
Density structure
In an elastic body like the Earth, the seismic velocities vp and vs at any point depend on the local elastic moduli and the density. For most purposes, just two elastic moduli are needed: the incompressibility or bulk modulus, and the rigidity or shear modulus. The incompressibility measures the resistance to volume change under hydrostatic pressure, and the rigidity measures the resistance to change of shape under shear stress. Since there are just two measured quantities, vp and vs, the three parameters of the medium—density, bulk, and shear modulus—cannot be determined without additional assumptions and constraints. Two constraints are given by the Earth's mean density and moment of inertia. Another experimental constraint is given by laboratory measurements of the relation between vp and density for relevant rock samples. Further assumptions are that in each of the principal layers of the Earth, where the seismic velocity profile is smooth, the composition of the material is chemically homogeneous, and phase changes are absent. The density distribution in each layer can then be computed by a method developed by L. Adams and E. Williamson, with a correction term added by F. Birch in case the temperature gradient exceeds the adiabatic value. Bullen, in the 1930s, used these principles with the assumption of an adiabatic temperature gradient in the different layers (so that there is no correction term) to construct a density structure consistent with the seismic velocity model. Later in the 1970s, this density model could be tested independently by using free-oscillation eigenfrequencies. It is necessary to distinguish between toroidal and spheroidal oscillations. Particle motion in the latter has a nonzero radial component, and the eigenfrequencies depend on the density structure. The density structure needed to satisfy the free-oscillation data is remarkably similar to Bullen's original density model. The density structure of PREM is shown together with the seismic velocities in Fig. 2. For the core and lower mantle, deviations from homogeneous and adiabatic conditions are insignificant, except for the region immediately above the core–mantle boundary.
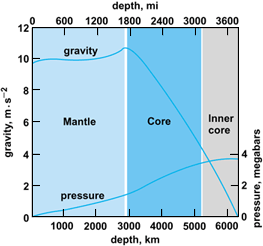
The incompressibility, the rigidity, the gravity, and the hydrostatic pressure inside the Earth are obtained as by-products of the density calculations. The incompressibility increases steadily with depth throughout the mantle and core, and its changes across the core–mantle boundary are remarkably small. The rigidity also increases steadily throughout the mantle, but the fluid outer core has zero rigidity. In the inner core the rigidity is again nonzero but is probably less than in the lower mantle. This gives an abnormally low ratio of shear to bulk modulus for the inner core. The variation of gravity and pressure inside the Earth is illustrated in Fig. 3. See also: Elasticity
Composition and state
Estimated abundances of rocky, refractory materials in meteorites and the Sun give a rough idea of what the Earth is composed of, although the relative proportions of metals and minerals in various portions of the Earth are not necessarily identical. To find out where and in which proportions the different materials reside in the Earth, high-pressure and high-temperature laboratory measurements are compared to the seismic and density structure. The Earth comprises a crust, a mantle, and a core, so that there is a compositional differentiation into at least three regions. Each of these regions is differentiated again, both vertically and, at least for the crust and upper part of the mantle, laterally. See also: Geochemical distribution of the Earth; High-pressure physics
Crust
The Earth's crust is on average about 12 mi (20 km) thick but is thinner under oceans and thicker under continents. Thickness under some high mountain ranges may be up to 36 mi (60 km; the so-called mountain roots). The boundary between the crust and the underlying mantle is called the Mohoroviˇić discontinuity or, more usually, the Moho. The continental and oceanic portions of the crust have different compositions. Continental crust can be divided into a lighter, granitic upper crust and a lower crust that is more basaltic, like the oceanic crust. Despite the striking heterogeneity of the crust, some generalizations can be made. Both the crust and the mantle are rich in silicates, but the mantle has much more magnesium, and the crust has proportionally more of the relatively light elements such as calcium, aluminum, sodium, and potassium in the form of oxides. It has been noted that the relative abundance of these light elements in the stony meteorites leads to an expectation that much more of these elements should be on Earth than is contained in the crust. The missing part may be contained in former crust that has been subducted in the process of plate tectonics and is now on its way to being recycled throughout the mantle. Only oceanic crust is being subducted. See also: Convection in the Earth; Earth's crust; Meteorite; Moho (Mohorovičić discontinuity); Plate tectonics
Mantle
This is the region between the crust and the core. It is common to make a distinction between the upper mantle and lower mantle, which are separated by the so-called 670-km discontinuity at a depth of 416 mi.
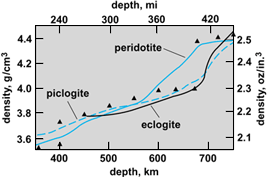
The upper mantle includes the lithosphere below the crust, the asthenosphere, and the region of phase transformations (the transition zone). It contains also the subducting slabs of oceanic lithosphere. The difference between continental and oceanic crust extends to at least the bottom of the lithosphere and probably to the bottom of the asthenosphere. It is believed that the stiff lithosphere and the soft asthenosphere differ mainly in mechanical strength, not in composition. The shallow part of the upper mantle is likely to be relatively depleted in the light elements typical of the crust. A comparison with estimates for stony meteorites (chondrites) and for the Sun (Table 3) serves to illustrate the depletion. On the other hand, the light elements do not seem to be underrepresented in estimates of the composition of the deeper parts of the upper mantle. It has been suggested that this region contains more eclogite, the high-pressure form of basalt, which is subducted with the oceanic lithosphere. It is the densest common upper-mantle mineral. Olivine is probably the most abundant upper-mantle mineral. At pressures prevailing near 240 mi (400 km) depth, it transforms to a denser structure (spinel), with a density increment of about 10%. Phase transformations of other common upper-mantle minerals are also expected at the depths spanned by the transition zone (Fig. 4). See also: Basalt; Eclogite
| Component | Chondritic | Solar | Lherzolite† |
|---|---|---|---|
| Mantle | |||
| MgO | 37.7 | 32.7 | 42.2 |
| SiO2 | 52.5 | 45.0 | 42.2 |
| Al2O3 | 3.8 | 3.2 | 2.1 |
| CaO | 3.0 | 3.4 | 1.9 |
| FeO | 3.3 | 15.7 | 8.7 |
| MgO/SiO2 ratio | 0.718 | 0.727 | 0.955 |
| Core | |||
| Fe2O | 32.2 | 32.0 |
*After D. L. Anderson, Where on Earth is the crust?, Phys. Today, 42:38–46, 1989.
†Composed mainly of olivine. Believed to be the major rock type in shallow upper mantle.
The lower mantle, the mantle below 416 mi (670 km), appears to have a homogeneous composition down to the boundary layer above the core. Experimental results seem to indicate that mineralogy is dominated by ferromagnesium oxides (wüstite) and silicates (perovskite). The high-pressure perovskite phase of ferromagnesium silicate is thought to be the most abundant mineral of the Earth. See also: Perovskite
670-km discontinuity
This represents the transition from upper to lower mantle. There seems to be no compelling geochemical evidence against the view that the presumed dominant lower-mantle minerals are the high-pressure products of upper-mantle spinel, and there would be no chemical change across the boundary. On the other hand, such a change is not precluded by the evidence either, and an increased iron oxide content for the lower mantle is sometimes proposed. In any case, the transition represents a density increase of perhaps 10% and a viscosity increase by perhaps a factor of 10. It is not clear that subducted lithospheric slabs can penetrate this barrier. In fact, the seismic evidence suggests that some slabs do penetrate but others do not. One speculative model consistent with these results is that relatively young, thin oceanic plates are trapped at the boundary, but the upper, cool differentiated parts of thick plates may break through. It would imply a leaky barrier to mantle flow.
Core–mantle boundary layer
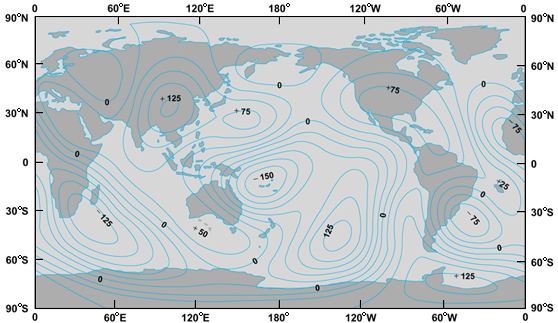
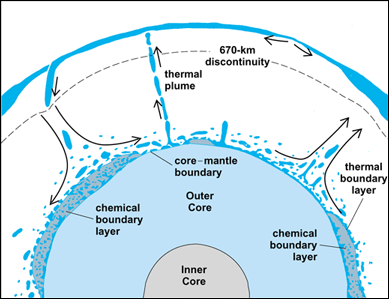
This is often identified with the layer labeled D′ in Bullen's original seismic model. The seismic heterogeneity in this layer has a wide spectrum of scale lengths. Figure 5 is a smoothed picture of large-scale lateral variations of P-wave velocity. Significant small-scale features are also inferred. From temperature considerations it is clear that the seismic anomalous layer is also a thermal boundary layer, and it has been proposed that this layer becomes unstable and forms convection plumes. The very big contrast in composition and material properties across the core–mantle boundary (Table 4) also creates favorable conditions for chemical heterogeneity above the boundary, although the observational evidence is unclear. The argument is that patches of material intrinsically denser than the bulk of the mantle will be trapped at the boundary, in much the same way as the relatively light continents are considered to be left over on the surface of the Earth. The analogy explains the wording “continents on the core–mantle boundary.” However, unlike the surface of the Earth, the boundary itself is relatively smooth, with undulations of the order of a kilometer or less. This may be a consequence of low viscosity of the material at the boundary. Ironically, although it might seem that seismology would put strong constraints on topography of the boundary, the initial maps showed very large undulations. With the results of a more recent seismological study in agreement with a relatively smooth boundary but requiring variations in the boundary layer, the paradox appears to be removed. A speculative diagram synthesizing the various pieces of information is shown in Fig. 6.
| Composition | Iron + 10% (O, S, Si, C)† | Magnesium-iron oxides and silicates |
|---|---|---|
| State | Molten alloy | Subsolidus |
| Temperature | 3800–4700 K (6380–8000° F) | 2600–3100 K (4680–5120° F) |
| Flow velocity | 0(101) km/year | 0(10−4) km/year |
| Viscosity | 0(10−2 – 103) Pa · s | 1022 – 1023 Pa · s |
| Density | 9.90 × 10³ kg/m3 | 5.57 × 10³ kg/m3 |
| Rigidity | 0(0?) Pa | 2.911 × 10¹¹ Pa |
| Electrical conductivity | 105 – 106 S/m | 10−2 – 102 S/m |
| Incompressibility | 6.35 × 10¹¹ Pa | 6.85 × 10¹¹ Pa |
*After T. Lay, Structure of the core-mantle transition zone: A chemical and thermal boundary layer, Eos, 70:49–59, 1989.
†O = oxygen; S = sulfur; Si = silicon; C = carbon.
Core
This is the central region of the Earth. Its seismic and density structure are well matched by a solid inner core of iron or nickel iron and a liquid outer core of iron mixed with about 10% lighter material. Candidate light elements are sulfur and oxygen, with some preference for the former. The outer core can be taken as homogeneous for all practical purposes. Seismic Q suggests that the inner core boundary is at the melting point. This is not the melting point of pure iron; the presence of impurities in the liquid depresses the melting point considerably.
Core–mantle coupling
This is believed to be responsible for decade-long variations in the length of the day of up to about 5 milliseconds. The idea is that fluid flow in the outermost regions of the core is coupled to the mantle, so that the rotation rate of the mantle can fluctuate in response to time variations of the flow in the core. This view is supported by an observed correlation between the decade variations in the length of the day and certain variations of the geomagnetic field (the latter being associated with core flow). The coupling may be electromagnetic or topographic. It has been suggested that topographic coupling can be quite effective, provided that there is indeed topography on the core–mantle boundary (of the order of a few hundred meters).
Temperature
Mantle temperature estimates are constrained by the following: (1) A melting-point curve for the mantle is obtained from laboratory measurements of the melting point of presumed mantle minerals under pressure. The actual temperature should not be too far below the melting point in order that material can flow. (2) Convection is supposed to be the dominant mode of heat transport below the lithosphere. In a slowly convecting system the temperature gradient is probably slightly superadiabatic, which is a gradient larger than that prevailing under adiabatic conditions. (3) The temperature gradients in the crust can be measured. Since conduction is the mode of heat transport through the lithosphere, temperatures can be estimated by extrapolating the surface temperature downward, until the melting point curve for the mantle is approached. This point is often taken as the bottom of the lithosphere, and temperatures in the mantle are estimated by extrapolating downward from this point; a schematic temperature profile is shown in Fig. 7. The thermal gradients on continents and under oceans differ substantially, and continental lithosphere is thicker than oceanic. At the base of the mantle a thermal boundary layer with a strongly superadiabatic gradient exists. Estimates of core temperature suggest that the temperature jump across this layer is larger than is indicated in Fig. 7. The figure does not suggest a thermal boundary layer between the upper and lower mantle (near 416 mi or 670 km depth); but this is, in fact, an unresolved problem.
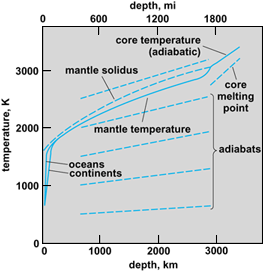
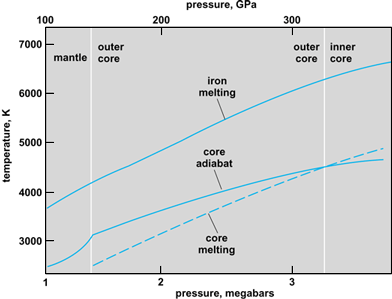
Core temperature presumably follows a nearly adiabatic gradient, at least in the convecting outer core. A calibration point for the temperature profile is provided by laboratory measurements of the melting point of iron under high pressure and by assuming the inner core boundary is at the melting point. This point is about 1000 K (1800°F) below the melting point of pure iron under the same pressure, since the liquid iron (in the outer core) is not pure but has about 10% light material mixed in. A temperature profile for the core is shown in Fig. 8. More recent estimates of the melting point of iron under high pressure are higher than suggested in Fig. 8, and so the actual temperature profile will be correspondingly higher.
Heat sources are the radioactive elements, especially in the continental crust and the upper mantle, and the slowly cooling Earth itself. The total surface heat flux is about 3 × 10¹³ W, and cooling may contribute about a quarter of this value. A flux of about 3 × 10¹² W through the core–mantle boundary may be due to cooling of the core and the consequent crystallization of the inner core, although the possibility of heating due to decay of radioactive potassium (40K) cannot be neglected. The crystallization process itself is a good example of ongoing differentiation of the Earth. See also: Earth's heat flow; Radioactivity
Geomagnetic dynamo
The Earth's magnetic field has been studied for centuries, but it is only rather recently that an understanding of the generation of the field has developed. In 1946 W. Elsasser proposed a model of the magnetic field generated by inductive motions in a liquid core. Evidence for a liquid core came 20 years earlier, when H. Jeffreys noted the absence of seismic S waves passing through the core. A geomagnetic dynamo theory, based on the work of W. Elsasser and later on that of E. Bullard, is probably the only theory capable of explaining the important features of the magnetic field such as reversals, secular variation, and the near alignment of the dipole and rotation axes. However, the mathematical problems are formidable, and as yet no satisfactory dynamo model exists that reproduces secular variation and reversals. An intriguing hypothesis is that these features are governed by conditions in the core–mantle boundary layer. See also: Geomagnetism
Reversals
This term refers to polarity transitions of the dipole part of the geomagnetic field. The field on the Earth's surface is about 90% dipole. Paleomagnetic results have demonstrated that the polarity of the field has reversed many times in the past, but the frequency of reversals appears to be nonstationary. One hundred million years ago the magnetic field was in the middle of a 30-million-year period of normal polarity (the Cretaceous quiet interval). This is in sharp contrast to the behavior both 150 million years ago and recently, when the mean polarity interval is of the order of several hundred thousand years. Although the connection is unclear, such long-term changes are currently believed to be related to variations in the thickness of the core–mantle boundary layer; thermal boundary-layer studies indicate that such variations can occur. It is speculated that when the layer is thick, the cooling rate and power supply are small and the field is in a quiescent state, with reversals infrequent or even absent. Conversely, when the layer is thin, the cooling rate and power supply are large and the field is in an agitated state with frequent reversals, which is the state occurring at present. See also: Paleomagnetism
Secular variation
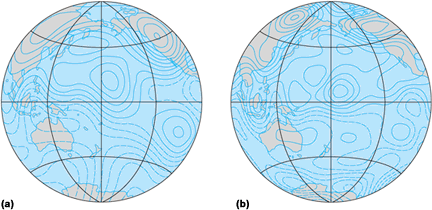
Included in the secular variation of the magnetic field, among other factors, is the westward drift of the field and the decrease of the dipole field strength during the past few hundred years; if the decrease continues at the present rate, a reversal will occur in roughly a thousand years. The secular variation of the magnetic field at the Earth's surface has been reasonably documented during the past few hundred years. J. Bloxham and D. Gubbins have made an estimate of the field at the core–mantle boundary during this time period that implies inverting the observed data of the surface magnetic field. In Fig. 9 the field is shown for the years 1715 and 1980. It is striking that some prominent features seem to be stationary, and the speculation is that these features are controlled by lateral temperature variations in the core–mantle boundary layer.
Energy source
The source of the energy for the geodynamo can be specified on the basis of an energy balance argument. It is estimated that the power needed for the dynamo process itself is about 4 × 10¹¹ W. It is also estimated that in the process a heat flux equaling about 2.7 × 10¹² W flows through the core–mantle boundary by conduction. An obvious heat source is radioactive decay; this requires a certain amount of radioactive potassium in the outer core. The problem with this process is the very low efficiency; only about 5.5% of the heat is becoming available to power the dynamo.
Another mechanism not suffering from an efficiency problem has been proposed. When the core cools, solid iron (or nickel-iron) freezes out on the boundary of the inner core, leaving a lighter constituent behind in the outer core. The rising of the lighter material through the liquid core leads to so-called compositional convection, and its efficiency is very high. The additional latent heat of crystallization is less important in that respect.
Assuming the inner core has grown to its present size in about 3 billion years, the available power may exceed 4 × 10¹¹ W if the density jump across the inner core boundary exceeds 0.302 oz/in.3 (0.5 g/cm3). The density difference is thus a crucial quantity for the geodynamo. In principle, seismology can provide estimates of the density. In practice, the density jump across the inner core boundary is not well resolved.


