Key Concepts
The star around which the Earth revolves and the source of our planet's light and heat. Containing 99.8% of the solar system's mass, the Sun holds all the system's planets and objects under its gravitational sway. The Sun measures 1.4 million km (865,000 mi) in diameter and with a mass 333,000 times that of the Earth. The surface temperature of the Sun is about 6000 K (5700°C or 10,000°F); since solids and liquids do not exist at these temperatures, the Sun is entirely gaseous. Almost all the gas is in atomic form as plasma, a hot, ionized state of matter. Appearing as an extremely bright disk in the sky, the Sun is too bright to look at except during sunrise or sunset, when the light must travel through substantially more of Earth's atmosphere to reach an observer (Fig. 1). See also: Earth; Earth rotation and orbital motion; Gravitation; Matter (physics); Planet; Plasma (physics); Solar system; Star

As a star, the Sun is a typical member of the spectral class G2 V, according to the standard system of classification long used by astronomers. The Roman numeral V (“five”) stands for normal stars, known as dwarfs; larger stars are known as giants or supergiants. Being a typical dwarf star, the Sun is placed on the so-called main sequence in the Hertzsprung-Russell diagram, which plots luminosity against temperature. Most stars are cooler and smaller than G class stars, placing the Sun in the upper 5% of stars in its neighborhood with regard to size and temperature. See also: Hertzsprung-Russell diagram; Spectral type
The light and heat of the Sun, helped by a modest greenhouse effect, make the Earth habitable. The Sun is the ultimate source of nearly all the energy utilized by industrial civilizations in the form of water power, fossil fuels, and wind, not to mention direct forms of solar energy through solar panels and heating of fluids from mirrors reflecting sunlight. Only atomic energy, radioactivity, geothermal heating, and the lunar tides are current nonsolar sources of energy. See also: Astrobiology; Energy; Energy sources; Greenhouse effect; Insolation; Solar energy
Besides its great importance to human life, the Sun is of interest to astronomers because it is the only star close enough for detailed study of its surface structure and localized particle emissions, as well as their relation to fundamental solar physics and astrophysics, more broadly. Various solar phenomena, including surface and atmospheric features such as sunspots and the hot corona, are studied and extrapolated to other stars. See also: Astronomy; Physics
Formation of the Sun
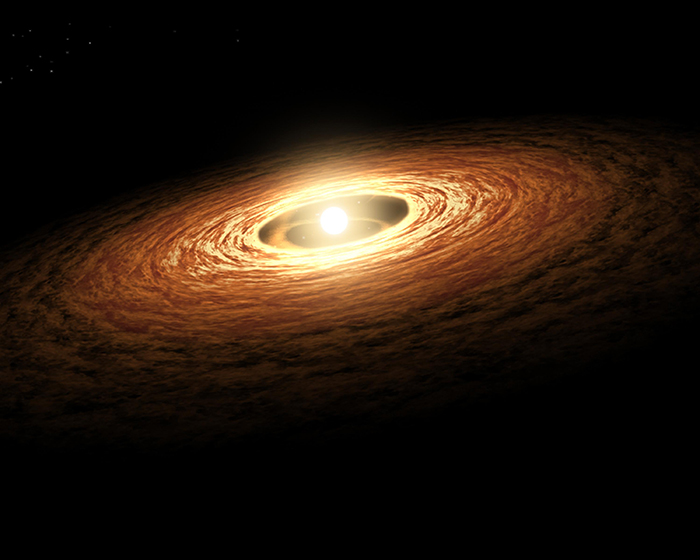
Like all stars, the Sun formed from the gravitational collapse of a relatively small portion of cold gas within a large reservoir of matter known as a molecular cloud. A resulting spherical object, called a protostar, continued collapsing in on itself. This process proceeded until the pressure and temperature rose high enough in the protostar's core to ignite thermonuclear fusion, exerting an outward, stabilizing pressure against continued collapse. Material in a disk around the newly formed Sun started to coalesce into planets, asteroids, and other objects that compose the solar system (Fig. 2). This formation process initiated approximately 4.6 billion years ago. The Sun has enough hydrogen fuel to last another five billion years before evolving into a type of star called a red giant, sloughing off much of its mass a planetary nebula, and then persisting for many more billions of years as a stellar remnant known as a white dwarf star. See also: Giant star; Molecular cloud; Protostar; Solar system; White dwarf star
Location of the Sun
The Sun is just one of approximately 300 billion stars in the Milky Way Galaxy, which itself is but one of trillions of galaxies in the universe. Within the Milky Way, the Sun is located approximately 26,000 light-years from the Galactic center, in a minor spiral arm named the Orion Spur. The Sun and its gravitationally bound solar system move through the Milky Way, completing an orbit—or a Galactic year—in about 225–250 million Earth-years. See also: Galaxy; Light-year; Milky Way Galaxy; Universe
Solar structure, behavior, and properties
The interior of the Sun has long been studied by inference from the observed properties of the entire star, though it is now understood in detail through helioseismology, described below. The Sun's mass, radius, surface temperature, luminosity and other characteristics are well-known (Table 1). Using the known properties of gases, it is possible to calculate that the structure of the Sun that would produce the parameters observed at the surface. Gravity makes the great mass of the Sun press down on the center, requiring a gas with a central density of near 153 g/cm3 and a temperature of 16 million K (16 million °C or 29 million °F) to support it. At these huge temperatures and densities, nuclear reactions take place. The radiation produced flows outward, changing over about a million years from gamma rays to visible light along its path from the Sun's core. The light is then radiated into space at the Sun's surface (photosphere). See also: Nuclear reaction; Gamma rays; Photon
|
Characteristic |
Value |
|---|---|
|
Mean distance from Earth (the astronomical unit) |
1.4960 × 10⁸ km = 9.2956 × 10⁷ mi |
|
Radius |
(6.957 ± 0.001) × 105 km = (4.323 ± 0.001) × 105 mi |
|
Mass |
(1.9885 ± 0.0001) × 1033 g = (4.3840 ± 0.0002) × 1030 lb |
|
Mean density |
1.408 ± 0.001 g/cm3 |
|
Surface gravity |
(2.740 ± 0.001) × 104 cm/s2 = 899.0 ± 0.4 ft/s2 = 28 × terrestrial gravity |
|
Total energy output |
(3.8275 ± 0.0014) × 1033 erg/s = (3.8275 ± 0.0014) × 1026 W |
|
Energy flux at surface |
(6.294 ± 0.004) × 1010 erg/(cm2)(s) = (6.294 ± 0.004) × 107 W/m2 |
|
Effective surface temperature |
5772.0 ± 0.8 K = 5498.9 ± 0.8°C 9929.9 ± 1.4°F |
|
Stellar magnitude (photovisual) |
−26.73 ± .03 |
|
Absolute magnitude (photovisual) |
+4.84 ± .03 |
|
Inclination of axis of rotation to ecliptic |
7° |
|
Period of rotation |
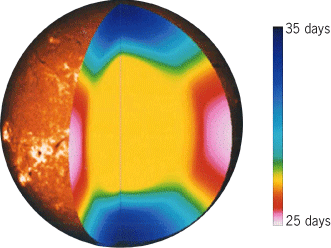
About 27 days; the Sun does not rotate as a solid body; it exhibits a systematic increase in period from 25 days at the equator to 36 days at the poles |
Helioseismology
The surface of the Sun is constantly oscillating with a wide range of modes. These motions are the surface manifestation of hundreds of trapped sound waves inside the Sun. The modes are global, coherent over the entire Sun; their lifetimes range from a day to several months. They are characterized by standard spherical harmonics Ylm; the high-frequency waves stay close to the surface, whereas those of low frequency reach deep into the star. The relation between the frequency and wave number (k ω diagram) specifies the sound speed throughout the Sun and hence the temperature as a function of depth. Comparing this with the pressure yields an estimate of the ratio of hydrogen to helium throughout the star. The National Solar Observatory's Global Oscillation Network Group monitors such solar ringing like a bell from the ground, and instruments on NASA's Solar Dynamics Observatory (SDO) and the European Space Agency's Solar and Heliospheric Observatory (SOHO) monitor the oscillations from space. See also: Helioseismology; Solar and Heliospheric Observatory; Solar Dynamics Observatory; Spherical harmonics
Energy production
The energy of the Sun is produced thermonuclear fusion, through the conversion of hydrogen into helium by the following process:

Known as the proton-proton chain, this reaction is the principal source of energy in all main sequence stars. Later in its evolution, about five billion years from now, the Sun's helium-filled core will contract and heat up, triggering helium fusion into the elements carbon and oxygen. See also: Nuclear fusion; Proton-proton chain; Thermonuclear reaction
Convection
In the outer regions of the solar interior, the temperature is low enough for ions and even neutral atoms to form and, as a result, atomic absorption becomes very important. The high opacity makes it very difficult for the radiation to continue outward, so steep temperature gradients are established that result in convective currents. Most of the outer envelope of the Sun, measured from helioseismology to extend 30% of the distance downward from the photosphere, is in such convective equilibrium. These large-scale mass motions are responsible for the complex phenomena observed at the surface. See also: Convection (heat)
Rotation
Because the Sun is a gaseous plasma, it need not rotate as a solid object such as the Earth. Indeed, observations of sunspots and other features on the Sun's surface show that the equator rotates once in 25 days, while the polar regions rotate in 36 days. The very center must rotate as a solid body. The internal distribution of rotation has been furnished by helioseismology (Fig. 3). The internal oscillation modes exhibit a range of frequencies from both approaching and receding hemispheres, and this permits a determination of the rotation rate as a function of depth and latitude. It is thought that solar magnetic fields are based on a dynamo created by the differential rotation. See also: Solar magnetic field; Stellar rotation
Radiation
Electromagnetic energy is produced by the Sun at all wavelengths. Important radiation has been measured from long radio waves with 300 m wavelengths down to x-rays and gamma rays of less than 0.1 nanometer. In addition, considerable energy is emitted in the form of high-energy particles known as cosmic rays. However, more than 95% of the energy is concentrated in the relatively narrow band between 290 and 2500 nm and is accessible to routine observation from ground stations on Earth. The maximum radiation is in the yellow-green region, and the eyes of human beings have naturally evolved to be sensitive to this range of the spectrum. The total radiation and its distribution in the spectrum are parameters of fundamental significance, because they measure the total energy output of the Sun and its effective surface temperature. This quantity was long called the solar constant, but because it does vary slightly is now known as total solar irradiance. The ultraviolet flux, however, varies by substantial factors depending on the exact wavelength, and this variation affects the Earth's upper atmosphere. See also: Color vision; Cosmic ray; Electromagnetic radiation; Solar constant; Solar radiation
Solar atmosphere
Although the Sun is gaseous, it can be seen only to the point at which the density is so high that the material is opaque. This layer, the visible surface of the Sun, is termed the photosphere, and it is the bottom layer of the three layers composing the solar atmosphere. Light from farther down inside the Sun reaches the Earth only via repeated absorption and emission by the photosphere's atoms; deeper levels inside the Sun thus cannot be seen directly. See also: Photosphere
The next atmospheric layer, above the photosphere, is called the chromosphere. The light from this region is dominated by the red hydrogen alpha spectral line, which gives the chromosphere a rosy color seen at a solar eclipse (and inspired its name, meaning "sphere of color") (Fig. 4). The chromosphere is a rapidly fluctuating region of jets (spicules) and waves coming up from the surface. When all the convected energy coming up from below reaches the surface, it is concentrated in the thin material and produces considerable activity. Where the magnetic field is stronger, these waves are absorbed, and raise the temperature to 7000–8000 K (6700–7700°C or 12,000–14,000°F). The scale height of the chromosphere is 1000 km (600 mi) or more. See also: Chromosphere; Eclipse

When the Moon obscures the Sun at a total solar eclipse, the vast extended atmosphere of the Sun called the corona can be seen. Being a million times fainter than the photosphere, the corona is visible only during eclipse events or with very special instruments, called coronagraphs, from high altitudes on Earth or from space, or extreme-ultraviolet filters at selected wavelengths. The solar corona's density is low, but its temperature is high (more than one million K, or one million °C or 1.8 million °F). The frequent expulsion of significant quantities of matter from the corona are known as coronal mass ejections (CMEs). The hot gas of the corona flows steadily to the Earth and farther in the solar wind, the name given to the outflow of charged particles from the Sun. See also: Coronagraph; Solar corona; Solar wind
Solar composition
Of the 92 natural elements, at least 64 are represented in the spectrum of the Sun as Fraunhofer lines, which are dark absorption features that identify atoms and molecules (Table 2). The remaining elements are undoubtedly present, but remain undetected because they are rare or their lines are produced in spectral regions little-studied with spectrographs. The relative abundances of the most numerous atoms have been estimated from the line intensities. Many of these abundances have been confirmed by measurement of the relative abundances of different elements in the streams of particles coming from the Sun at the time of solar flares or from analyses of meteorites. The element abundances, and especially the ratios of certain isotopes, help inform the models of the formation of the Sun and planets. Overall, the Sun is about 90% hydrogen, 10% helium and with traces (0.1%) of the other elements. See also: Cosmic abundance of elements; Cosmochemistry; Fraunhofer lines; Solar system
|
Element |
Number |
|---|---|
|
Hydrogen, H |
1,000,000 |
|
Helium, He |
85,000 |
|
Oxygen, O |
600 |
|
Carbon, C |
320 |
|
Neon, Ne |
90 |
|
Nitrogen, N |
70 |
|
Magnesium, Mg |
40 |
|
Iron, Fe |
33 |
|
Silicon, Si |
32 |
|
Sulfur, S |
14 |
|
Aluminum, Al |
2.8 |
|
Argon, Ar |
2.5 |
|
Calcium, Ca |
2.2 |
|
Sodium, Na |
1.7 |
|
Nickel, Ni |
1.7 |
*Based on data from M. Asplund et al., The chemical composition of the Sun, Annu. Rev. Astron. Astrophys., 47:481–522, 2009; and E. Caffau et al., Solar chemical abundances determined with a CO5BOLD model atmosphere, Solar Phys., 268:255–269, 2010.
Granulation
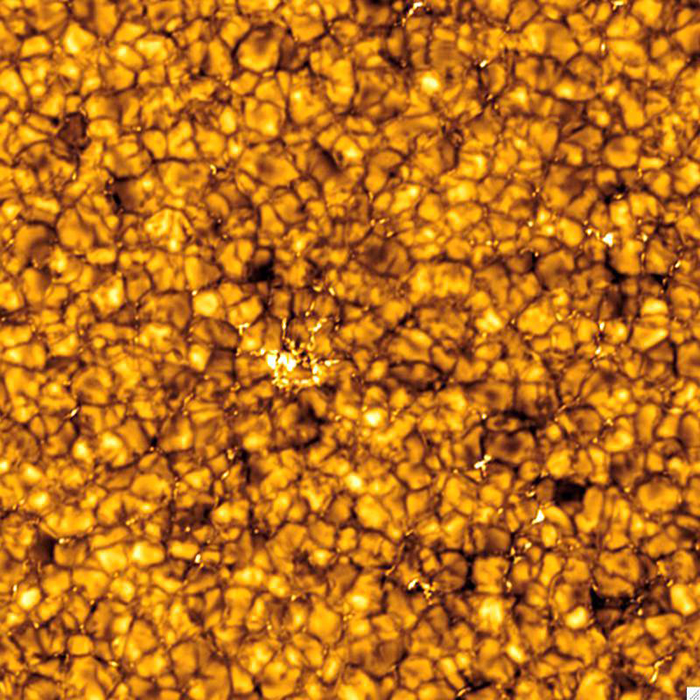
Except for sunspots and accompanying activity, the photosphere is quite uniform over the Sun. The gas pressure dominates the magnetic fields below 1000 gauss (0.1 tesla). The only structure visible in broadband images is the granulation (often called the rice grains), an irregular distribution having the shape of bright corn kernels with dark lanes in between (Fig. 5). The grains are Texas-sized, about 1000 km (600 mi) across, and have a life span of about 8 min. The dark lanes between the granules are about 200 km (120 mi) across. The granulation is visible evidence of convective activity below the surface. The bright grains are the tops of hot, rising columns that bring energy up from the interior, while the dark intergranular lanes are the cool downward-moving material. Sometimes a bright filigree is visible in the dark intergranular lanes. In addition, a larger scale of convection, called supergranulation, can be seen in Doppler images of the Sun's surface. The supergranular cells are about 30 granules across, and their life span is about 12 days. There is an outflow to the edges of these cells, concentrating the magnetic fields there. See also: Supergranulation
Solar activity
Within the solar atmosphere, many transient phenomena occur that may all be grouped under the heading of solar activity. They include sunspots and faculae in the photosphere, flares and plages in the chromosphere, prominences of chromospheric temperature that extend into the corona, and a variety of changing structures in the corona. The existence and behavior of all these phenomena are connected with magnetic fields, and their frequency waxes and wanes in a great 22-year cycle called the sunspot cycle or, more generally, the solar-activity cycle. The sunspots and flares are sources of x-rays, cosmic rays, and radio emission, which often have profound influence on interplanetary space and the upper atmosphere of the Earth.
Sunspots
Sunspots were discovered around 1610 CE independently by a German son-and-father team Johannes and David Fabricius, German astronomer Christoph Scheiner, Italian physicist and astronomer Galileo Galilei, and English astronomer Thomas Harriot, and were sporadically observed afterward. For over 200 years they were thought to occur at random, until German chemist and astronomer Heinrich Schwabe, who carried out regular observations in hopes of spotting a planet inside the orbit of Mercury, announced in 1843 that their number rose and fell with a 10-year period. Subsequent study of the old records revealed an 11-year period since the original discovery (Fig. 6). See also: Mercury (planet)
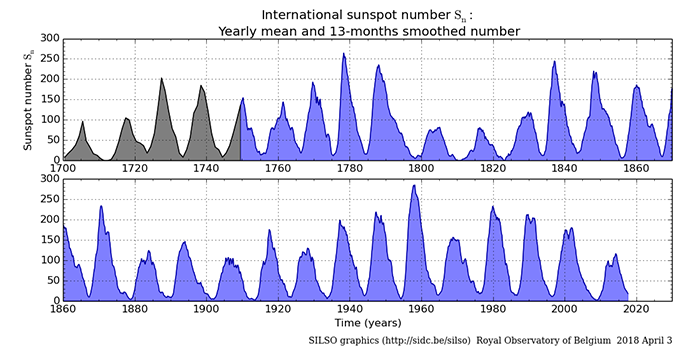
The number of sunspots peaks soon after the beginning of each cycle and decays to a minimum in 11 years. The first spots of a cycle always occur at higher latitudes, between 20° and 35°, and the latitude of occurrence decreases as the cycle unfolds (Spörer's law). Almost no spots are observed outside the latitude range of 5–35°. The great majority are small and last a few days, but some last for two rotations. In 1908, U.S. astronomer George Ellery Hale used the Zeeman effect to discover that sunspots had strong magnetic fields. Each spot group contains positive and negative magnetic polarity. Hale found that the polarities were mirrored, with the same polarity generally leading in one hemisphere and following in the other. He found that with each new cycle, the lead polarity switches, so that the complete magnetic cycle lasts 22 years. Because each new cycle starts a few years before the end of the previous one, the average duration of a half-cycle is nearly 14 years. See also: Magnetism; Zeeman effect
The darkness of sunspots is probably due to the intense magnetic fields (3000 gauss or 0.3 tesla), which cool the surface by suppressing the normal convective energy flow from below. It takes several days for the darkening to occur. Although sunspots are cool, their neighborhoods undergo the hottest and most intense activity, generally referred to as an active region. Magnetic energy is continually released there through reconnection processes of opposite magnetic fields. The corona above an active region is hot and dense, roughly three times hotter and denser than in quiet regions.
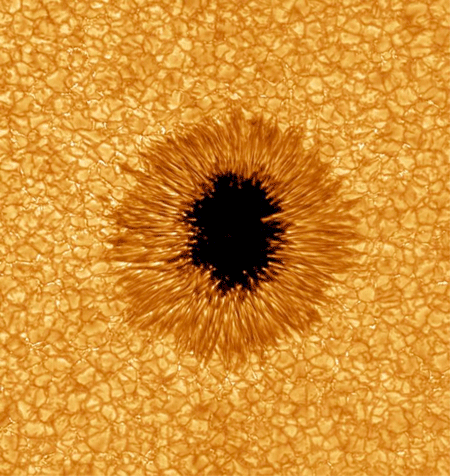
A typical mature sunspot is seen in white light to contain a central dark area, the umbra, where the magnetic field is strong and vertical, surrounded by a less dark band called the penumbra, where the magnetic field spreads out radially, with gradually increasing downward tilt, forming an aura of dark fibrils across the granulation (Fig. 7). The umbra is about 3000 K (2700°C or 5000°F), cool enough to form molecules. The pressure inside the spot, consisting of magnetic and gas pressure, must balance the outside pressure; however, the magnetic field has a steeper height gradient than the pressure, so it is impossible to balance at all heights. Therefore, strong outflows occur in the penumbra, called the Evershed effect.
When the sunspots die out (a matter of days or weeks), some of the magnetic fields sink below the surface, and other fields break off and spread across the surface. These fields are concentrated in the edges of the chromospheric network, which has the same scale as in the quiet Sun but is much brighter in the chromospheric lines. In this way, the supergranulation drives the distribution of the magnetic fields brought to the surface by the spots. While local fields are mixed and irregular, the huge spot fields form extended unipolar regions of enhanced polarity. Because the poles rotate more slowly than the equator, the fields lag behind each sunspot group as they drift poleward, forming a butterflylike global pattern. The unipolar regions of following polarity gradually drift to the pole and establish a new dominant magnetic polarity. The new field is that of the following spots, opposite to the polarity of the preceding sunspots that dominate most spot groups. There is some evidence that a meridional poleward flow is responsible.
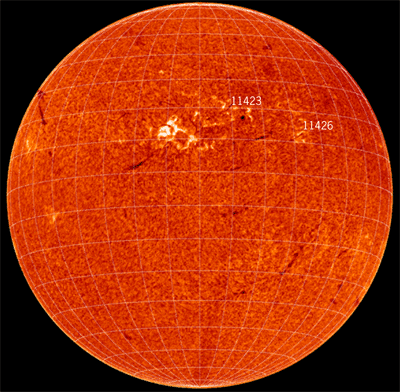
This process reverses the polar magnetic fields every 11 years, and with it the interplanetary magnetic fields that the solar wind carries out from the Sun. Some models of solar activity propose that, as the sunspots of the parent cycle die away, this large-scale dipole field is amplified by the differential rotation to produce a new cycle of sunspots, opposite in polarity to the preceding one. The large unipolar magnetic regions spreading out from centers of activity are easily recognized in pictures taken in light emitted by hydrogen, called Hα or calcium monochromatic pictures of the Sun because they are particularly bright. Their boundaries are usually marked by large prominences, accumulations of material in the atmosphere supported by the horizontal field. These are seen as dark filaments (Fig. 8).
Prominences
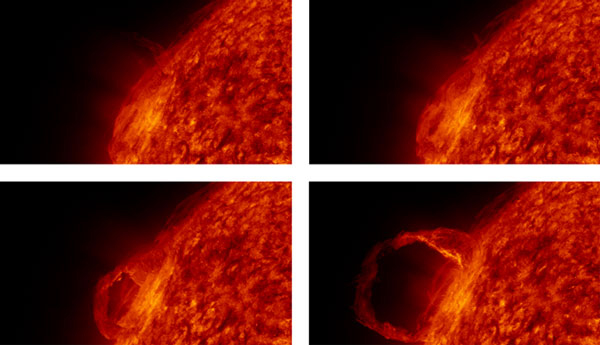
The term “prominence” is used for any cloud of relatively cool gas in the corona, where it appears bright against the sky. (When viewed against the disk of the Sun, prominences look dark when they are cooler than the solar surface and are known as filaments.) Prominences have roughly chromospheric temperatures and so are also especially well seen in the spectral lines of hydrogen. Being much denser than the corona, prominences must be held up against gravity by horizontal magnetic fields, making them good markers of magnetic boundaries. When the magnetic structure changes, prominences become unstable and erupt, always upward (Fig. 9). They also may be ejected by solar flares or appear as graceful loops raining from the corona after flares. The fact that prominences never fall down to the solar limb testifies to their magnetic support. The gas is ionized and cannot fall through the horizontal fields. The spectra of prominences show a number of bright emission lines of various elements, mostly singly ionized. Analysis of these lines shows that long-lived, stable prominences have a temperature of about 4000 K (3700°C or 7000°F), while transient prominences condensing from flares show many fewer lines and are more than 30,000 K (30,000°C or 54,000°F).
Plages
Just as prominences occur when the magnetic field changes from one sign to the other, bright regions called plages occur within the chromosphere whenever the magnetic field is vertical and relatively strong but not strong enough to form a sunspot. Plages can occur around sunspots, as well as remain for a few weeks to mark the location where a sunspot has died, and generally form where magnetic fields are concentrated. The photospheric equivalent of a plage is a facula.
Flares
The most spectacular activity associated with sunspots is solar flares (Fig. 10). A flare is defined as an abrupt increase in the Hα emission from the sunspot region. First observed in white light and Hα, which can be observed on Earth, since the 1970s, flares are classified in terms of their brightness in x-rays or extreme-ultraviolet (EUV) radiation. The brightening results from heating of the chromosphere at the footpoints of the magnetic field by a tremendous energy release in the atmosphere, resulting from the energy stored in the local magnetic field. From the footpoints, a cloud of hot material, up to 30 million K (30 million °C or 54 million °F) arises and concentrates at the arch tops. This cloud condenses out in an array of loop prominences. An active sunspot group produces a hierarchy of flares, a few large and many small ones. Flares are generally ranked by the peak soft x-ray flux as measured by the Geostationary Operational Environmental Satellites (GOES) and classified by the United States' National Oceanic and Atmospheric Administration (NOAA). The classes are A, B, C, M, and X, depending on whether the 0.1–0.8-nm peak flux is 10−8, 10−7, 10−6, 10−5, or 10−4 W/m2 at the Earth. Finer differences in flare strength are indicated by a number following the flare class letter; thus, X2 has a flux of 2 × 10⁻⁴ W/m2. Besides radiation output, solar flares also accelerate electrons and ionized atoms (including protons, which are ionized hydrogen) to speeds close to the speed of light. Neutrons also result, from interactions of protons with helium nuclei. See also: Neutron; Proton
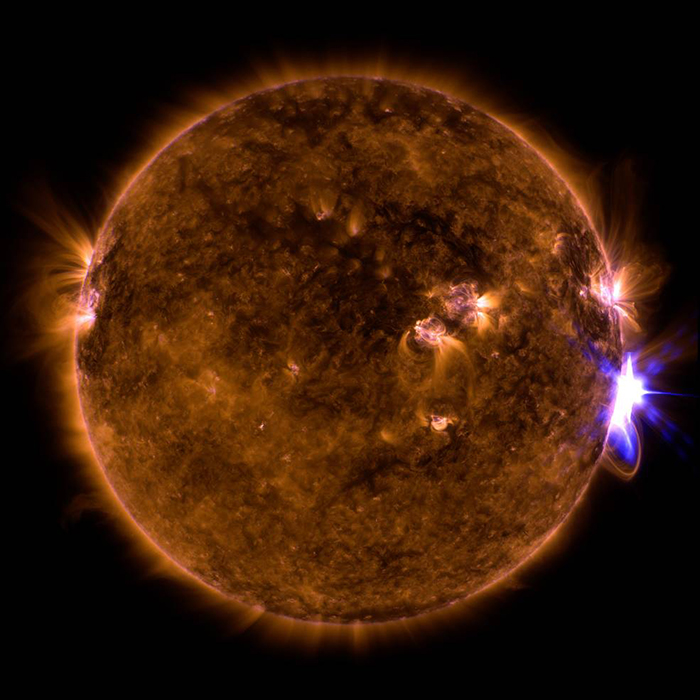
There is wide consensus that the energy needed to drive flares is released by the process of magnetic reconnection, in which the topology of highly stressed or jumbled magnetic field lines in the corona rapidly changes, resulting in new field configurations with lower energy. This process, and the flares that accompany it, are often associated with the eruption of prominences. A few minutes after the eruption begins, there is an abrupt acceleration and a storm of energetic particles is produced, heating the corona to flare brightness. When prominences not connected with active regions erupt, the brightening is notably much less. Prominence eruptions, primarily those just preceding flaring, are apparently the source of CMEs (Fig. 11).
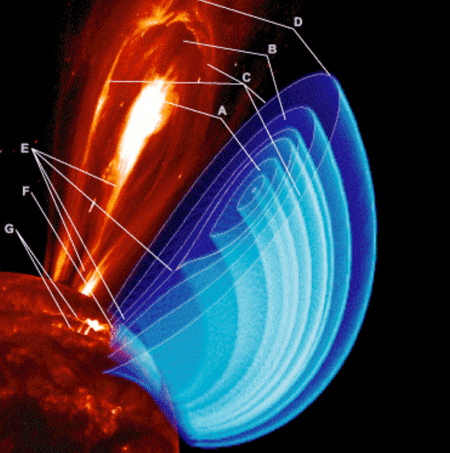
The flare produces a huge stream of solar energetic particles (SEPs) as well as a huge magnetohydrodynamic shock wave, which flies out at least as fast as 1000 km/s (600 mi/s) and continues into interplanetary space, often reaching the Earth. The wave produces a huge radio burst in the meter-wavelength range as it excites the coronal layers. The energetic nuclei produce gamma-ray lines from nuclear reactions as they penetrate to the photosphere. If they are sufficiently numerous, they heat the photosphere faster than it can re-emit energy and a white light flare is observed, usually in the form of bright transient flashes at the footpoints of the flare loops. The particles reach the Earth in a great particle storm. The SEPs can be hazardous to spacecraft and, potentially, to astronauts, and are a major limitation that must be considered in planning long voyages, such as to Mars from Earth. See also: Mars; Shock wave
Solar-terrestrial effects
The Earth is immersed in the solar wind and the magnetic fields streaming out from the Sun. Our planet is shielded from the particles by its magnetic field, and the surface is shielded from ultraviolet and x-ray photons by the upper atmosphere. The energetic particles can penetrate the magnetic field at geomagnetic latitudes around 65° (the magnetic pole is somewhat displaced from the true pole of rotation), leading to a magnetic reconnection between the Earth's magnetosphere and the solar particles. This region is called the auroral belt because particles coming in from the Sun produce frequent aurora borealis (northern lights) there, as well as aurora australis (southern lights) at the corresponding southern latitudes. See also: Aurora
The most energetic photons are absorbed in the upper atmosphere of the Earth above 70 km (42 mi) in a layer termed the ionosphere. Radio waves below 10 MHz frequency are reflected by the ionosphere, making possible intercontinental radio communication, but high levels of soft x-rays from flares increase the ionization in the lower ionosphere to the point where the waves are absorbed instead of reflected. The solar ultraviolet emission at longer wavelengths produces the ozone layer, which in turn absorbs that radiation and keeps it from reaching the ground. If ozone is destroyed, the solar radiation produces more. The radiation in question varies by 2–3% in a solar cycle, producing modest changes in the ozone. While communications utilizing direct high-frequency satellite links are unaffected by the ionosphere, systems such as the Global Positioning System require such sensitive timing that their position determinations are distorted by solar-produced fluctuations in the ionization of the atmosphere. Satellites in low Earth orbits are strongly affected by changes in the height of the outer atmosphere, which varies as it is heated by ultraviolet radiation and particles from the Sun. Thus, high levels of sunspot activity can bring about premature decay from orbit. See also: Communications satellite; Ionosphere; Magnetosphere; Ozone; Radio-wave propagation; Satellite navigation systems; Space communications; Stratospheric ozone
The most spectacular effects are caused by geomagnetic storms. These storms are the invasion of the magnetosphere by clouds of solar particles from flares, coronal mass ejections, and so-called coronal holes, which are regions of low corona density where hot gas can escape into space. The currents around the Earth induced by the great numbers of particles involved in geomagnetic storms produce sharp changes in the Earth's magnetic field, and the ionization produces considerable changes in the radio propagation. The magnetic fluctuations generate large voltages in long conductors such as power transmission nets and telephone lines. For example, sharp voltage changes in long-distance power transmission lines during a large geomagnetic storm a few days after a spectacular flare on March 10, 1989, fired circuit breakers in the Hydro-Quebec network and left Montreal without power for days. The same induced voltages disturb the logging of oil wells and other devices depending on voltages in long conductors. See also: Geomagnetic variations
Many scientists believe there is a link between the sunspot cycle and long-term weather trends, but it has proved very difficult to detect. Between 1650 and 1715 there were very few spots, and there is persuasive evidence for a Little Ice Age during this period, known as the Maunder minimum. This event shows that the cycle may not necessarily always produce spots, but as a single event it does not prove much. There was a remarkable coincidence between alternate (22-year) sunspot minima and droughts in the Great Plains of the United States in 1910, 1932, 1954, and 1976. Droughts are so sporadic, however, that direct statistical connections are not very obvious. For example, 1980 was a year of heat and drought too, but at the maximum of the sunspot cycle. However, some analyses show that the likelihood of severe local droughts does peak at the 22-year minima, but the locality of the drought will move about. Measurements of isotope ratios in fossil water, which indicate the temperature at which the water fell as rain, also show evidence of 22-year periods. See also: Drought
It has been proposed that galactic cosmic rays ionize particles in the upper atmosphere and produce condensation nuclei for rainfall. During sunspot maxima the solar fields expand beyond the Earth and shield against galactic cosmic rays, so there is less rainfall then. However, this theory directly contradicts the observation of great plains droughts at sunspot minima. See also: Cosmic ray; Precipitation (meteorology)
Solar eclipses
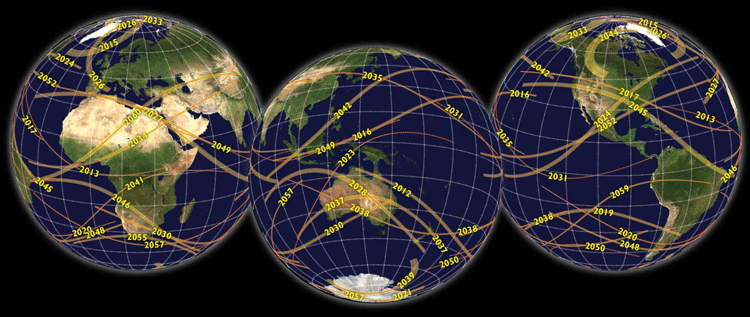
Solar eclipses remain the best way to study certain solar phenomena, since space missions are inflexible in instrumentation once launched and are limited by cost and design to a set of priorities. For example, it remains possible to obtain higher resolution over a wider scale in images of the solar corona at total solar eclipses, to observe in the infrared and other spectral regions not well covered from space, to observe with higher spectral resolution, and to observe with higher time resolution. Total solar eclipses are visible somewhere on Earth at intervals that average 18 months (Fig. 12). See also: Eclipse
